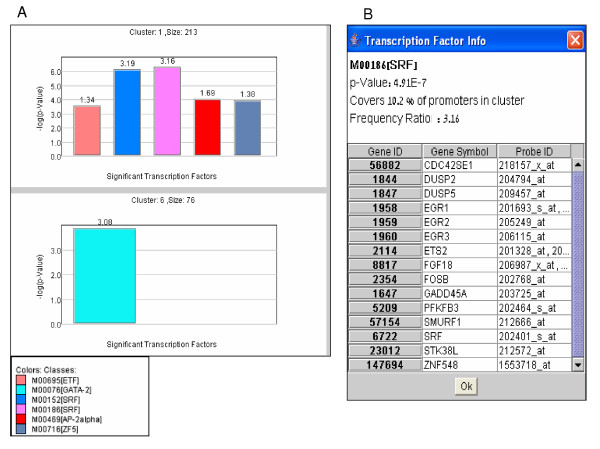
Figure 6.
Promoter cis-regulatory elements enrichment. (A) Transcription factors (TFs) whose DNA binding site signatures are over-represented in promoters of the genes assigned to the clusters are displayed in bar diagrams. Like the display for the GO analysis (Fig. 5), each diagram corresponds to a specific gene group (cluster or bicluster), TFs are color-coded and identified by the accession number of their binding site model in TRANSFAC DB. The statistical significance of the observed enrichment for a TF is represented by the height of its bar (-log10(p-value)). The TF enrichment factor, which is the ratio between the prevalence of the TF hits in the gene group and in the background set of promoters, is indicated above the bar. (B) Clicking on a specific bar pops-up a window that lists the genes in the group whose promoters were found to contain a hit for that TF. In this window, genes are linked to central annotation DB of the analyzed organism as specified in the legend of Figure 5.

