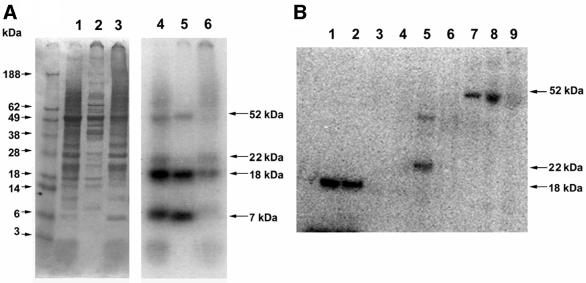
Fig. 1. Detection of Chlamydomonas selenoproteins. Chlamydomonas cells were grown in the presence of 75Se, collected by centrifugation, disrupted by sonication, and the resulting homogenate centrifuged at 18 000 g for 30 min. In (A), fractions were analyzed by SDS–PAGE. Lanes 1–3 (left panel) show homogenate, supernatant and pellet, respectively, stained with Coomassie Blue (protein markers are shown in the left-most lane and their sizes indicated on the left) and lanes 4–6 (right panel) show respective lanes in the same gel exposed to PhosphorImager detection of 75Se (sizes of detected selenoproteins are shown on the right). In (B), the soluble fraction [shown in (A), lane 2] was fractionated on a Q-Sepharose column. Lanes 1 and 2 show the flow-through fractions and contained the 7 and 18 kDa selenoproteins, and lanes 3–9 the fractions that eluted in the salt gradient (see Materials and methods). The 22 kDa selenoprotein shown in lane 5 eluted at ∼150 mM NaCl, and the 52 kDa selenoprotein shown in fractions 7–9 eluted at 400 mM NaCl in buffer B. Proteins were detected by PhosphorImager analysis of an SDS–PAGE gel.

An official website of the United States government
Here's how you know
Official websites use .gov
A
.gov website belongs to an official
government organization in the United States.
Secure .gov websites use HTTPS
A lock (
) or https:// means you've safely
connected to the .gov website. Share sensitive
information only on official, secure websites.
