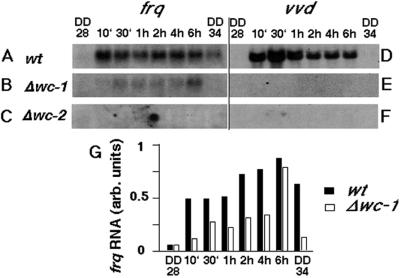
Fig. 3. Light-induced RNAs determined by northern blot analysis. (A–C) frq RNA levels; (D–F) vvd RNA levels. (A) and (D) are samples from wild-type cultures; (B) and (E) are from Δwc-1; and (C) and (F) are from Δwc-2, where the panels are overexposed. Loading of RNA was controlled by probing for rRNA (not shown), and these values were used for quantification. (G) Quantification of frq RNA induction as shown in (A) and (B). The harvest times are indicated, up to 6 h after lights-on, with DD28 (DD indicates constant darkness, e.g. 28 h) and DD34 representing the dark controls harvested at the beginning and the end of the light exposure.

An official website of the United States government
Here's how you know
Official websites use .gov
A
.gov website belongs to an official
government organization in the United States.
Secure .gov websites use HTTPS
A lock (
) or https:// means you've safely
connected to the .gov website. Share sensitive
information only on official, secure websites.
