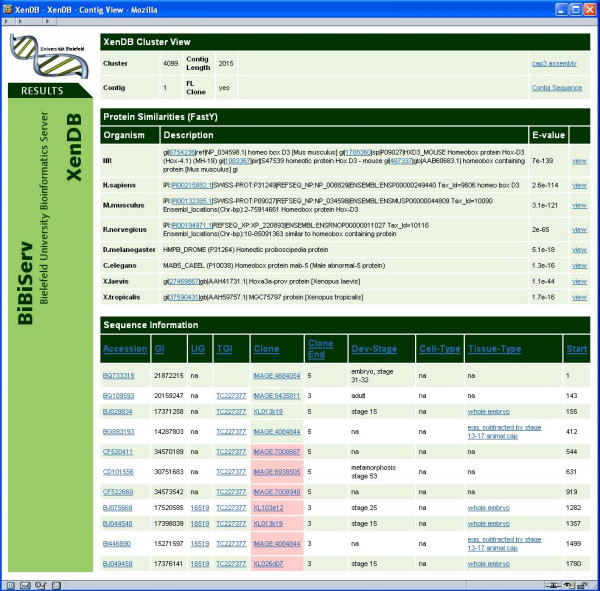
Figure 5.

Cluster view of the XenDB Web interface. Best FASTY hits to NR protein database, five model organisms and Xenopus proteins are shown on top. Gene Ontologies (GO) are based on best human and mouse IPI hits, functional categories on hits to COG and KOG databases. Below, additional information for each EST in the cluster is shown, such as accession, UniGene and TGI id, clone, cell and tissue type. Clones predicted not to be full length are colored red. Links to CAP3 assembly and TC sequence are provided.
