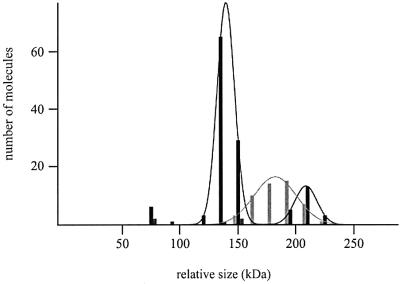
Fig. 5. Volume distribution of UvrB–DNA complexes (grey bars) and protein–DNA complexes formed after the addition of UvrC(R42A) to these purified UvrB–DNA preincision complexes (black bars). The lines represent the Gaussian fitting of the distribution and the values obtained are reported in Table III.

An official website of the United States government
Here's how you know
Official websites use .gov
A
.gov website belongs to an official
government organization in the United States.
Secure .gov websites use HTTPS
A lock (
) or https:// means you've safely
connected to the .gov website. Share sensitive
information only on official, secure websites.
