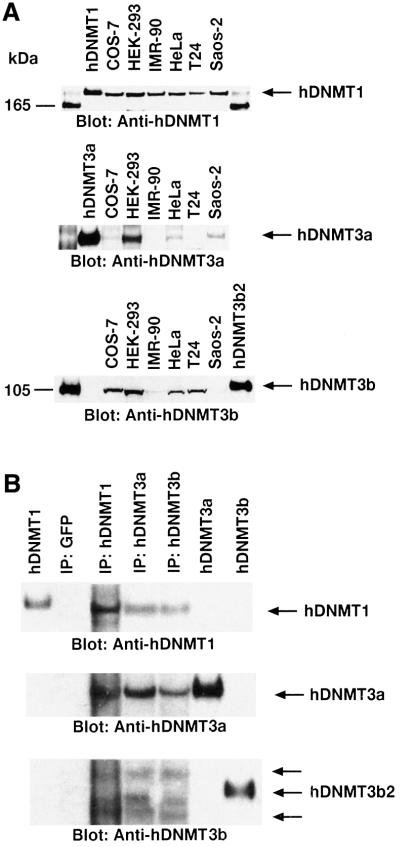
Fig. 2. Expression profile and interactions between DNMTs in human cells. (A) Western blot analyses of DNMT1 (top), DNMT3a (middle) and DNMT3b (bottom) are shown. Nuclear extracts from different cell lines were used as indicated at the top, along with the positive control proteins hDNMT1, hDNMT3a and hDNMT3b. Molecular weight markers (in kDa) are in the extreme left and right lanes. Arrows indicate the relative locations of the endogenous DNMTs. Note that the same western blot gel was probed with three different antibodies for relative quantitation of the DNMTs. (B) Immunoprecipitation of hDNMTs in HEK-293 cell nuclear extracts. Antibodies used are indicated at the top. Control hDNMT1, hDNMT3a and hDNMT3b proteins were used as reference. Arrows on the right show the relative locations of the protein. Anti-hDNMT1, -hDNMT3a and -hDNMT3b antibodies were used for detection. Two additional arrows on the hDNMT3b western blot indicate the splice variants of hDNMT3b.

An official website of the United States government
Here's how you know
Official websites use .gov
A
.gov website belongs to an official
government organization in the United States.
Secure .gov websites use HTTPS
A lock (
) or https:// means you've safely
connected to the .gov website. Share sensitive
information only on official, secure websites.
