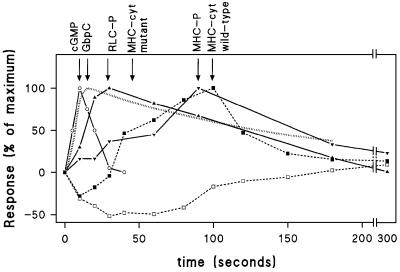
Fig. 8. Time course of the cGMP and myosin responses in wild-type cells. The responses were calculated by first subtracting basal levels of unstimulated cells and are then expressed as a percentage of the maximal response. Data are from Figures 2, 5 and 6; the cGMP occupancy of GbpC is taken from Van Haastert et al. (1982a). Symbols refer to cGMP (open circles); phosphorylation of RLC (filled triangles); phosphorylation of MHC (filled inverted triangles); MHC in the cytoskeleton of wild-type cells (filled squares); and MHC in the cytoskeleton of gca–/sgc– and gbpC–D– cells (open squares). The cGMP occupancy of GbpC is presented as a dotted line.

An official website of the United States government
Here's how you know
Official websites use .gov
A
.gov website belongs to an official
government organization in the United States.
Secure .gov websites use HTTPS
A lock (
) or https:// means you've safely
connected to the .gov website. Share sensitive
information only on official, secure websites.
