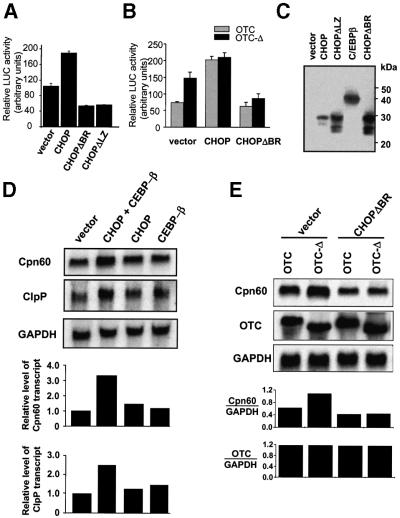
Fig. 5. Effect of CHOP expression on Cpn60/10 promoter activity. (A) Overexpression of CHOP and C/EBPβ activates the Cpn60/10 promoter. COS-7 cells were co-transfected with the Cpn60/10 promoter reporter construct and cDNA encoding C/EBPβ, as well as either vector alone, wild-type CHOP cDNA or CHOP constructs lacking either the basic DNA-binding region (CHOPΔBR) or the leucine zipper region (CHOPΔLZ). Relative LUC activity was measured 36 h after transfection. Results represent the mean of transfections performed in triplicate ± SEM. (B) CHOP-dependent induction of MSR. The effect of a dominant-negative mutant of CHOP (CHOPΔBR) on the MSR was measured by co-transfecting cells with the Cpn60/10 promoter reporter construct, OTC constructs (OTC, grey bars; OTC-Δ, black bars), cDNA encoding C/EBPβ and either vector alone, wild-type CHOP or CHOPΔBR cDNA. Relative LUC activities were measured in cell extracts 36 h after transfection and represent the mean of transfections performed in triplicate ± SEM. (C) Level of expression of transcription vectors. The expression of CHOP constructs and C/EBPβ by transfected cells (30 µg of total protein/lane) is shown by western blot analysis using specific antibodies. (D) Overexpression of CHOP and C/EBPβ increases the level of Cpn60 and ClpP transcripts. COS-7 cells were transfected with cDNA encoding CHOP and C/EBPβ and total RNA extracted from cells subjected to northern blot analysis. The blot was sequentially hybridized with radiolabelled Cpn60, ClpP and GAPDH cDNA probes (top panels). Blots were quantitated relative to GAPDH by PhosphorImager analysis (lower panels) with the ratio of transcripts from cells transfected with vector alone being set at 1.0. (E) Induction of Cpn60 transcripts by MSR is ablated by a dominant-negative form of CHOP. The effect of transfection of COS-7 cells with vector alone or dominant-negative mutant CHOPΔBR on Cpn60 mRNA levels was measured by northern blot analysis from cells co-transfected with wild-type OTC and OTC-Δ. The levels of wild-type and mutant OTC transcripts were also determined as a control (upper panels). Bands were quantitated by PhosphorImager analysis relative to the levels of GAPDH (lower panels).

An official website of the United States government
Here's how you know
Official websites use .gov
A
.gov website belongs to an official
government organization in the United States.
Secure .gov websites use HTTPS
A lock (
) or https:// means you've safely
connected to the .gov website. Share sensitive
information only on official, secure websites.
