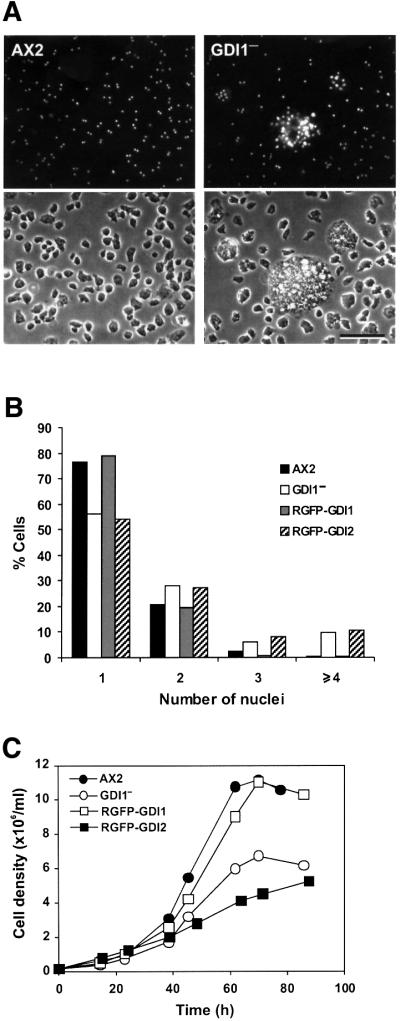
Fig. 3. GDI1– cells display cytokinesis and growth defects. (A) DAPI staining (top panels) and corresponding phase contrast (bottom panels) images of wild-type and mutant cells grown on glass coverslips. Scale bar, 50 µm. (B) Distribution of the number of nuclei in GDI1– and complementation mutants grown on coverslips. In the GDI1– mutant, cells with four or more nuclei account for ∼10% of the population. (C) Growth of GDI1 null and complementation mutants in shaking suspension. The growth and cytokinesis defects of GDI1– were restored after re-expression of GDI1. Curves are representative of at least three independent determinations, each performed in duplicate.

An official website of the United States government
Here's how you know
Official websites use .gov
A
.gov website belongs to an official
government organization in the United States.
Secure .gov websites use HTTPS
A lock (
) or https:// means you've safely
connected to the .gov website. Share sensitive
information only on official, secure websites.
