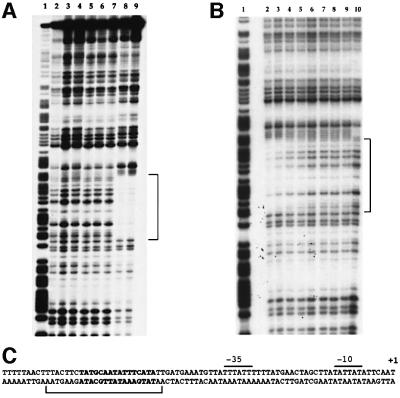
Fig. 6. DNase I footprinting analysis of PlcR binding to the plcA promoter region. Radiolabeled fragments (50 000 c.p.m.) were incubated with various concentrations of PlcR and OS5. (A) Lane 1, G+A Maxam and Gilbert reaction; lane 2, no protein; lane 3, 0.1 µg of PlcR; lane 4, 10 µg of PlcR; lane 5, 20 µg of OS5; lane 6, 0.1 µg of PlcR and 10 µg of OS5; lane 7, 0.1 µg of PlcR and 20 µg of OS5; lane 8, 10 µg of PlcR and 10 µg of OS5; lane 9, 10 µg of PlcR and 20 µg of OS5. The region protected by PlcR is indicated by a bracket. (B) Lane 1, G+A Maxam and Gilbert reaction; lanes 2–8, 50 pmol of PlcR (1.7 µg) and OS5: lane 2, 1000 pmol (0.65 µg); lane 3, 500 pmol; lane 4, 150 pmol; lane 5, 70 pmol; lane 6, 35 pmol; lane 7, 10 pmol; lane 8, 5 pmol; lane 9, 50 pmol of PlcR; lane 10, neither protein nor peptide. (C) plcA promoter region. The DNase I-protected area is indicated by a bracket and the PlcR box is in bold. Positions are relative to the transcription start point. The –35 and –10 promoter regions, and the transcription start (+ 1) of the plcA gene, are indicated as described previously (Lereclus et al., 1996).

An official website of the United States government
Here's how you know
Official websites use .gov
A
.gov website belongs to an official
government organization in the United States.
Secure .gov websites use HTTPS
A lock (
) or https:// means you've safely
connected to the .gov website. Share sensitive
information only on official, secure websites.
