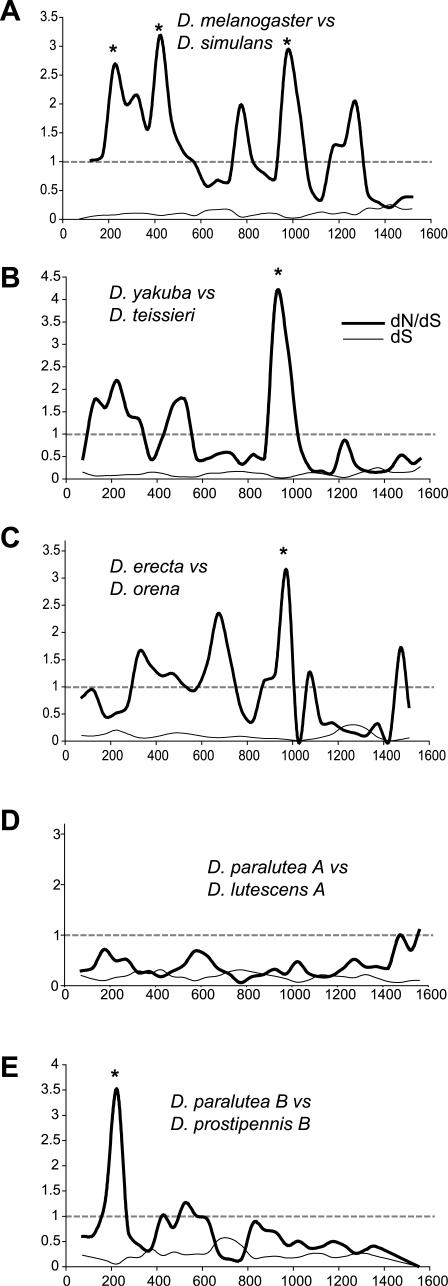
Figure 7. Sliding Window dN/dS Analyses of Different Drosophila Iris Genes.
We have chosen non-overlapping sets of the Drosophila species to do a pair-wise analysis of dN compared to dS. We present a sliding window analysis (window size 150 base pairs, slide of 50 base pairs) of dS and the dN/dS ratio (y-axis) plotted against nucleotide position (x-axis). Under neutrality, a dN/dS ratio of 1 is expected (dashed lines). We present a comparison of (A) D. melanogaster versus D. simulans, (B) D. yakuba versus D. teissieri, (C) D. erecta versus D. orena, (D) D. paralutea A versus D. lutescens A, and (E) D. paralutea B versus D. prostipennis B. In all these comparisons except (D), at least one window where dN/dS significantly exceeds 1 is seen (indicated by asterisks; significance tested by simulations in the K-estimator program [43]).

