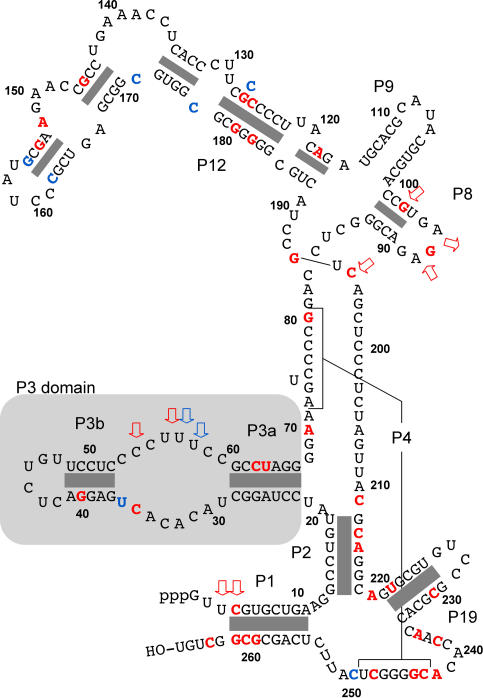
Figure 1. RMRP Gene Product.
The RNA molecule of the human RNase MRP complex is shown according to the model of Welting et al. [29]. Nucleotides affected by mutations (single nucleotide changes) are in red; polymorphisms and rare variants are in blue. Insertion/duplication/deletions are indicated as red (mutations) or blue (putative polymorphisms) arrows. Regions of base-pairing are indicated as gray boxes. The P3 domain (nucleotides 22–66) is shaded.

