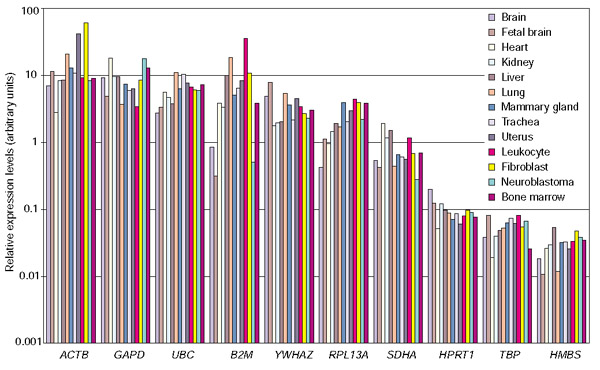
Figure 5.

Logarithmic histogram of the expression levels of 10 internal control genes determined in 13 different human tissues, normalized to the geometric mean of 6 control genes (GAPD, HPRT1, SDHA, TBP, UBC, YWHAZ). An approximately 400-fold expression difference is apparent between the most and least abundantly expressed gene, as well as tissue-specific differences in expression levels for particular genes (for example, B2M).
