
Figure 2.
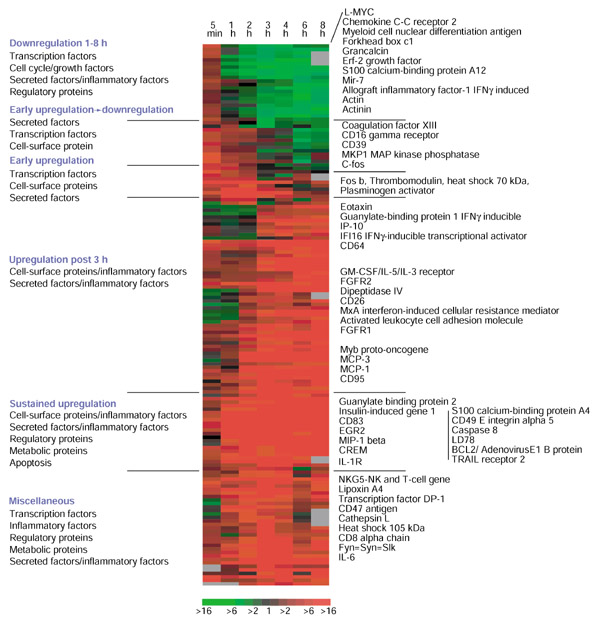
Time-course analysis of changes in gene expression in PBMC in response to IL-2 stimulation in vitro. The clusterogram represents a group of genes filtered from 6,500 cDNA clones expressed ≥ 3-fold between reference and test samples in at least 70% of the experiments. Red indicates upregulation in test samples compared with the pre-IL-2 reference sample and green indicates downregulation. Suggested functional signatures based on kinetics of expression and gene annotations are given on the left. On the right, selected genes from individual clusters relevant to immune regulation are shown.