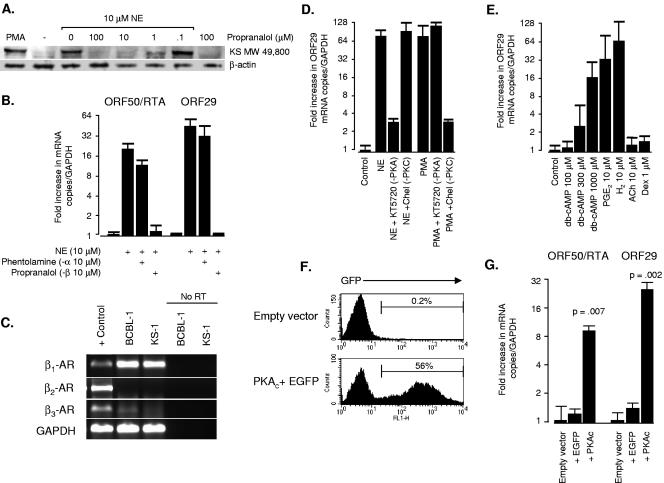
FIG. 2.
Role of the β-adrenergic receptor and cAMP/PKA signaling pathway in norepinephrine-induced reactivation of KSHV. (A) To define the role of β-adrenergic receptors in norepinephrine-mediated reactivation of lytic gene expression, BCBL-1 cells were treated with indicated concentrations of the β-antagonist propranalol for 1 h before exposure to 10 μM norepinephrine, and then assayed for KSHV lytic protein expression by Western blot 48 h later (primary antibody: Kaposi's sarcoma patient serum). Results show induction of the major KSHV lytic protein species at MW 49,800 which was the only band diagnostic of reactivation by the PMA positive control. (B) Specificity of adrenergic receptor involvement was tested by treating KS-1 cells with the α-antagonist phentolamine or the β-antagonist propranalol for 1 h prior to norepinephrine (NE) exposure; 24 h later, concentrations of mRNA for the immediate-early ORF50/RTA and late ORF29 were assessed by real-time RT-PCR (values normalized to GAPDH and expressed as a ratio relative to vehicle-treated controls). (C) Expression of mRNA for β1, β2, and β3 adrenergic receptors was assessed in untreated KS-1 and BCBL-1 cells by real-time RT-PCR. Products were resolved on a 3.5% agarose gel and compared to positive control PCR products (parallel amplification of genomic DNA for β1 and β3 adrenergic receptors or a PBMC cDNA library for β2 adrenergic receptors and GAPDH). To verify that RT-PCR results were free of contaminating DNA, BCBL-1 and KS-1 RNA samples were amplified in parallel in the absence of reverse transcriptase (No RT). Data are representative of four independent experiments in which β1 adrenergic receptors were consistently detected at high levels, and β2 and β3 receptors were not significantly expressed. (D) To evaluate the role of PKA and PKC in norepinephrine activation of KSHV lytic gene expression, KS-1 cells were pretreated with the PKA antagonist KT5720 (1 μM) or the PKC antagonists chelerythrine chloride (Chel, 1 μM) or bisindolylmaleimide HCl (300 nM) for 1 h prior to norepinephrine exposure. Expression of mRNA for the late lytic gene ORF29 was assayed by real-time RT-PCR 24 h later. PKA blockade inhibited norepinephrine-induced lytic gene expression by >90%, but PKC inhibitors failed to block norepinephrine effects. Chelerythrine and bisindolylmaleimide (data not shown) efficiently blocked PMA induction of ORF29, verifying that inhibitors were capable of blocking known PKC activators. KT5720 failed to block PMA-mediated ORF29 expression, indicating that norepinephrine/PKA and PMA/PKC signaling pathways are functionally independent in PEL cells. (E) To determine whether cAMP activity was sufficient to induce lytic gene expression, KS-1 cells were treated with graded doses of pharmacological db-cAMP or with indicated concentrations of physiological cAMP inducers prostaglandin E2 (PGE2) and histamine (H2). cAMP/PKA specificity was evaluated using hormones that signal through alternative pathways, such as acetylcholine (ACh) or the glucocorticoid dexamethasone (Dex). (F) To determine if PKA activity alone is sufficient to induce lytic gene expression, KS-1 cells were transduced with a lentiviral vector (34) expressing the catalytic subunit of PKA (PKAc) and a downstream EGFP reporter sequence translated from a single mRNA bearing the PS3 synthetic internal ribosome entry site (73). At 48 h following transduction with an empty vector, or vector bearing bicistronic EGFP and PKAc, EGFP-positive cells were quantified by flow cytometry to assess transduction efficiency. Cells transduced with EGFP alone showed transduction efficiencies comparable to comparable to EGFP plus PKAc (data not shown). (G) Also at 48 h posttransduction, concentrations of mRNA for immediate-early ORF50/RTA and late lytic ORF29 were quantified by real-time RT-PCR (data normalized to GAPDH and expressed as a ratio relative to empty vector controls). Data represent the mean (± standard error) of three independent experiments, with statistical significance evaluated by paired t test. Similar effects were observed with BCBL-1 cells (data not shown).

