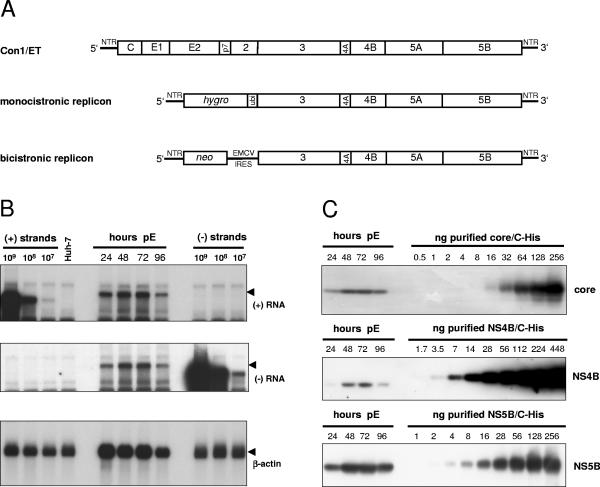
FIG. 1.
Quantification of HCV RNA and nonstructural proteins in Huh-7 cells transfected with a full-length genome. (A) Structure of the HCV RNAs used in the present study. Con1/ET represents a full-length HCV genome harboring cell culture-adaptive mutations in NS3 and NS4B (64). The monocistronic replicon contains only a single ORF consisting of nt 342 to 389 of the core-coding region, the hygro gene (encoding the hygromycin phosphotransferase), the ubiquitin-encoding sequence (Ubi), and the HCV NS proteins NS3 to NS5B (24) and was used to select Huh-7 cell clone 11-1, which was analyzed in the present study (Table 1). The bicistronic replicon is composed of the first 377 nt of the HCV genome fused to the neo gene (encoding the neomycin phosphotransferase). Translation of the HCV NS proteins NS3-5B is initiated by the encephalomyocarditis virus-IRES. The bicistronic replicon was used to generate cell-clone 9-13 (53). (B) Time course of HCV positive- and negative-strand synthesis after transfection of Con1/ET RNA into Huh7-Lunet cells. Cells were harvested and counted at the time points indicated above the figure (pE, postelectroporation), and total RNA was prepared. A total of 5 μg of total RNA corresponding to 2.5 × 10⁵, 2.1 × 10⁵, 2.1 × 10⁵, and 2.3 × 10⁵ cells at 24, 48, 72, and 96 h, respectively, was subjected to Northern hybridization with radiolabeled riboprobes specific for the detection of HCV positive-strand (top panel), negative-strand (middle panel) or β-actin (lowest panel). Specific signals are indicated by arrowheads. Signals were quantified by phosphorimaging with known amounts of in vitro transcripts of positive or negative polarity corresponding to a subgenomic replicon and normalized for different loadings by the β-actin signal. Total RNA from naive Huh-7 cells was used as negative control (Huh-7). (C) Quantification of HCV core (upper panel), NS4B (middle panel), and NS5B (lowest panel) expression after transfection of Con1/ET RNA into Huh7-Lunet cells. An aliquot of the cells harvested for total RNA preparation at the time points given above each panel was lysed in Laemmli sample buffer and subjected to immunoblot analysis with monoclonal antibodies (NS5B) or polyclonal antisera (core, NS4B) with the specificities given on the right. Samples were quantified by comparison of signal intensities derived from known amounts of the respective antigens as indicated above each panel. The amount of loaded proteins correspond to 1.2 × 10⁵, 1.8 × 10⁵, 1.6 × 10⁵, and 2.0 × 10⁵ cells at 24, 48, 72, and 96 h, respectively.

