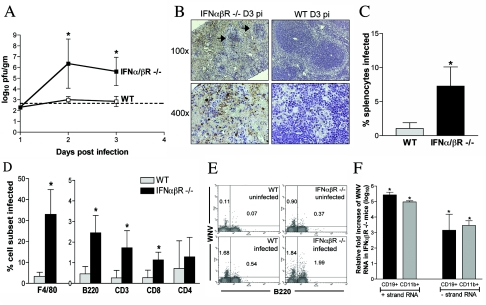
FIG. 4.
IFN-α/βR−/− mice show increased viral replication and altered tropism in the spleen. (A) Viral burden in the spleen of IFN-α/βR−/− and wild-type mice was determined from samples harvested on days 1, 2, and 3 p.i. by plaque assay. Data are shown as the average PFU per gram of tissue and represent average values from five mice per group. Error bars indicate standard deviations, and the dotted line represents the limit of sensitivity of the assay. (B) Immunohistochemical analysis of WNV antigen within spleen sections from WNV-infected IFN-α/βR−/− and wild-type mice at day 3 p.i. At low magnification, marked destruction of splenic architecture is observed in infected IFN-α/βR−/− mice with disrupted follicle structures (black arrows). Data are representative of staining performed on tissues from three mice per group. (C to F) Analysis of splenocytes derived from 8- to 9-week-old wild-type and IFN-α/βR−/− mice at day 3 p.i. Cells were costained for WNV antigen and cellular markers to determine the total percentage of splenocytes infected (C) and the percentage of the individual cell population infected (D). Data were averaged from four independent experiments performed on a total of five to nine age- and sex-matched mice per group. Error bars indicate standard deviations, and asterisks indicate differences that are statistically significant (*, P < 0.05). (E) Representative flow cytometry histograms of B220+ and WNV antigen-positive costaining in wild-type and IFN-α/βR−/− mice are shown. The numbers indicate the percentages of positive cells in each quadrant. (F) Total RNA from CD11b+ and CD19+ cells purified from infected spleens was analyzed for the levels of WNV-positive and -negative strands using strand-specific real-time RT-PCR. Data were normalized to 18S rRNA levels and are expressed as the relative severalfold increases in WNV RNA detected in IFN-α/βR−/− mice compared to that in infected wild-type mice. Average values are from six mice per group.

