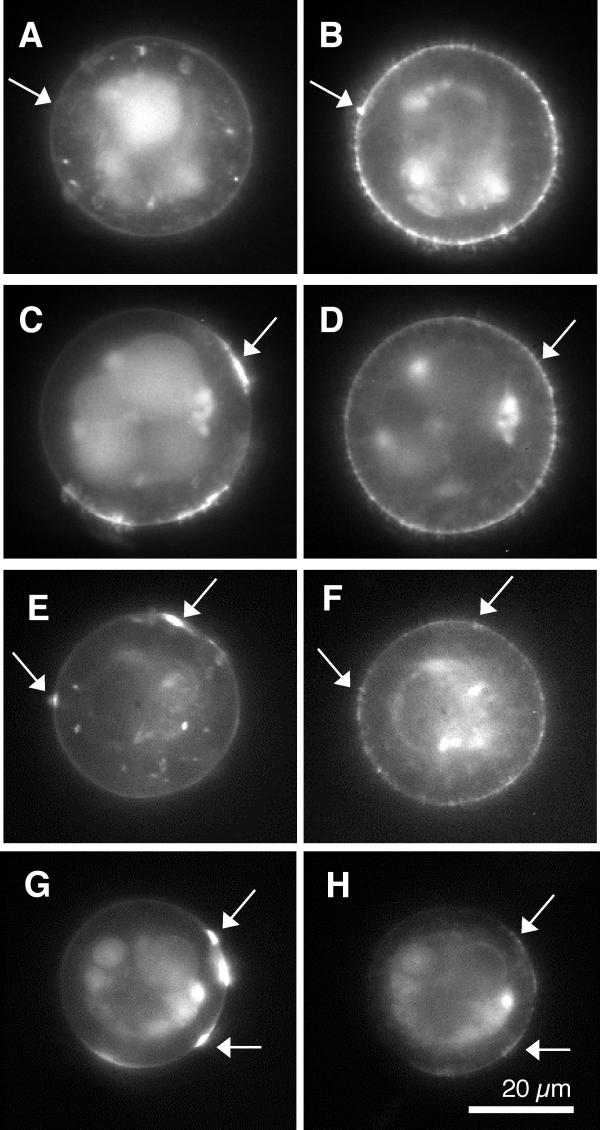
Figure 3.
Typical fluorescent micrographs of double labeled cell pairs following the stimulus protocols. Images on the left were fluorescein labeled for AChRs, while the corresponding images on the right were rhodamine labeled for α-DG . Note that the analysis is restricted to the perimeter of the images (Materials and Methods) A, B, no stimulus. The arrows illustrate a lack of contamination of the fluorescein (left) signal by the rhodamine (right) image. C, D, Agrin; arrows illustrate the absence of contamination of the rhodamine (right) image by the fluorescein label on the left. E, F, laminin; the arrows illustrate modest correlation between the two labels. G, H, Agrin and Laminin. The arrows indicate regions of substantial correlation between the two molecular distributions. The examples of correlation, and the lack thereof, are for purposes of illustration only and not representative of the respective stimulus conditions. See text for quantitative measures of correlation between the two molecular distributions.

