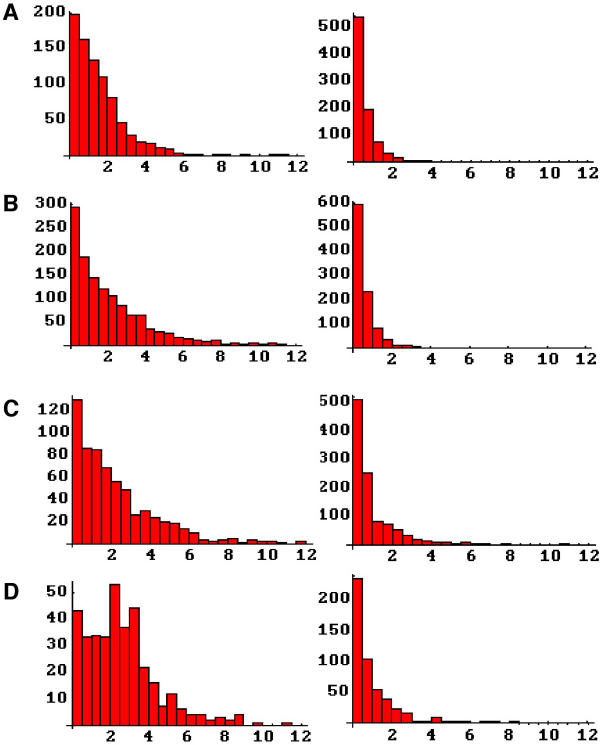
Figure 6.
Aggregate size distributions following the various stimulation protocols. Each left-right pair represents the frequency histograms of aggregate size for AChRs (left) and α-DG (right). A, controls (no stimulus). B, agrin. C, laminin. D, agrin and laminin. All abscissas are aggregate size in microns.

