Abstract
The time course of interaction of caldesmon with actin may be monitored by fluorescence changes that occur upon the binding of 12-(N-methyl-N-(7-nitrobenz-2-oxa-l,3-diazol-4-yl))-labeled caldesmon to actin or to acrylodan actin. The concentration dependence of the observed rate of caldesmon-actin binding was analyzed to a first approximation as a single-step reaction using a Monte Carlo simulation. The derived association and dissociation rates were 107 m−1 s−1 and 18.2 s−1, respectively. Smooth muscle tropomyosin enhances the binding of caldesmon to actin, and this was found to be due to a reduction in the rate of dissociation to 6.3 s −1. There is no evidence from this study for a different mechanism of binding in the presence of tropomyosin. The fluorescence changes that occurred with the binding of 12-(N-methyl-N-(7-nitrobenz-2-oxa-l,3-diazol-4-yl))-labeled caldesmon to actin or actin-tropomyosin were reversed by the addition of myosin subfragment 1 as predicted by a competitive binding mechanism.
The protein caldesmon inhibits the stimulation of myosin ATPase activity by actin (Dabrowska et al., 1985; Smith and Marston, 1985; Ngai and Walsh, 1985; Sobue et al., 1985). Caldesmon also inhibits force production when added to smooth muscle fibers (Pfitzer et al., 1993) and to skeletal muscle fibers, which normally lack caldesmon (Brenner et al., 1991). Several studies indicate that caldesmon has the potential to modulate contractility (Yamashiro et al., 1990; Walker et al., 1989; Hegmann et al., 1991; Katsuyama et al., 1992) although its primary role as a regulatory protein is not yet proven.
We have proposed that an important aspect of the inhibition of ATPase activity by caldesmon is the inhibition of binding of myosin subfragment 1 (S1)1 to actin in both the presence and absence of tropomyosin (Chalovich et al., 1987; Hemric and Chalovich, 1988; Velaz et al., 1989; Velaz et al, 1990; Chen and Chalovich, 1992). This view is not universally accepted, and other reports suggest that in the presence of tropomyosin and under conditions where S1 concentrations are high relative to caldesmon, inhibition of ATPase activity occurs with little reduction of Sl-ATP binding (Marston and Redwood, 1993). This latter model requires that the mode of action of caldesmon be quite different in the presence of tropomyosin.
Testing the different models of caldesmon both by mathematical modeling and by experimentation requires information regarding the rates of binding of caldesmon to actin in the presence and absence of tropomyosin. We have used two combinations of fluorescent probes to measure the concentration dependence of this association reaction. The concentration dependence of the observed association rates was analyzed by a simple Monte Carlo model assuming that the binding is a single-step mechanism.
EXPERIMENTAL PROCEDURES
Proteins
Smooth muscle tropomyosin was isolated from turkey gizzards either by the method of Bretscher (1984) or by a modification of the method of Graceffa (1992), which avoids heat treatment of the tropomyosin. Other proteins were prepared as described earlier (Chalovich et al., 1992).
For modification with IANBD, caldesmon was treated with 10 mM dithiothreitol for 30 min at 37 °C and then loaded onto a 1.5 × 15-cm column of ACA 202 (Spectrum) gel filtration resin equilibrated with 100 mm KCl, 50 mm Tris-HCl, pH 7.5, 1 mm EDTA. To the mixture was added a stock of 25 mm IANBD in dimethyl formamide to give a concentration 5 times that of the caldesmon concentration. The reaction was stopped by the addition of dithiothreitol to 1 mm after an incubation of 4 h at 18 °C. Unreacted probe was removed by gel filtration chromatography on ACA 202 resin. The extent of labeling was determined to be between 1.5 and 2 mol of probe/mol of caldesmon using an extinction coefficient of 2.6 × 10⁴ m1 cm−1 at 495 nm (Trayer and Trayer, 1988). Actin was labeled with acrylodan at Cys374 by incubating at 4 °C for 12 h in a solution containing 0.1 m NaCl, 10 mm Tris-HCl, pH 7.5, 2 mm MgCl2, and 1 mm NaN3 with a 5-fold molar excess of acrylodan. The extent of labeling was 70–100% as determined using an extinction coefficient of 1.29 × 10⁴ m−1 cm−1 at 360 nm (Prendergast et al., 1983).
To determine the location of the fluorescent probe, NBD-labeled caldesmon was digested with chymotrypsin (1:1000, w/w) for 5 min, and the products of reaction were analyzed by high pressure liquid chromatography on an SP-R cation exchange column (Waters) or by SDS-polyacrylamide gel electrophoresis. Polypeptides that had been previously determined to originate from the NH2-terminal myosin binding region (Velaz et al., 1990) and the COOH-terminal actin binding region (Chalovich et al., 1992) were fluorescently labeled. In preparations that were not completely labeled, the myosin binding fragment was more fluorescent than the actin binding fragments, suggesting a more rapid reaction of the probe with the former site. In another approach, the digested IANBD-labeled caldesmon was applied to a 1.5 × 9-cm calmodulin affinity column equilibrated with 5 mm Tris-HCl, pH 7.5, 100 mm NaCl, 1 mm MgCl2. The fluorescently labeled myosin binding fragment was in the breakthrough volume and was purified further as described earlier (Velaz et al., 1990). Intact caldesmon and the 35-kDa, 20-kDa, and smaller actin and calmodulin binding fragments were eluted by replacing the buffer with one containing 1 mm EGTA in place of the CaCl2. The 35- and 20-kDa actin binding fragments were purified as described previously (Chalovich et al., 1992).
Protein concentrations were determined by absorbance at 280 nm except for caldesmon, which was determined by the Lowry assay using bovine serum albumin as a standard. We have shown earlier that the Lowry assay gives an excellent estimate of the true caldesmon concentration (Velaz et al., 1989). The molecular weights used for calculation of protein concentrations were 120,000 (S1), 42,000 (actin), 68,000 (tropomyosin), 16,500 (calmodulin), 87,000 (caldesmon), and 20,000 (the actin binding fragments of caldesmon).
ATPase Assays
The ATPase activity of skeletal S1 was measured by the liberation of 32Pi from [32Pi]ATP as described earlier (Chalovich and Eisenberg, 1982).
Sequence Analysis
Partially purified polypeptides were run on SDS-10% polyacrylamide gels and electrophoretically transferred to Bio-Rad sequential grade polyvinylidene difluoride membrane. The fluorescent band was cut out of the membrane and sequenced at the UCLA Protein Microsequencing Facility.
Electron Microscopy
Samples were prepared by the drop method (Hayat, 1972) and negatively stained with 1% uranyl acetate. Samples were examined with a JEOL 1200EX electron microscope at 65 kV.
Steady State Fluorescence Measurements
Fluorescence was measured on a SPEX Fluorolog 2 spectrofluorometer in 0.4 x 1.0-mm cells at 15 °C. The excitation and emission slit widths were 1.25 mm (4.5-nm band-pass). Binding isotherms were constructed by maintaining the actin concentration at 1 or 2 μm and varying the caldesmon concentration. Results were most easily interpreted when the fluorescence of the actin probe was monitored so that the signal was proportional to the number of actin sites occupied. Curves of the fraction of caldesmon bound/total actin, or θ, versus free caldesmon were constructed by assuming that when the fluorescence no longer changed the actin was saturated. The free caldesmon concentration was calculated using the analysis of McGhee and von Hippel (1974) assuming different values of stoichiometry (n), isolated site binding constant (K), and cooperativity parameter (ω). These parameters were varied until there was a satisfactory fit to the experimental data. There is not a unique solution to such fluorescence titration data when the stoichiometry is unknown. The stoichiometry of binding is known to be 1 caldesmon per 7 (Velaz et al, 1989) or more (Smith et al, 1987) actin monomers; a value of 7 was used in the calculations. The MLAB program was used in this mathematical modeling.
Stopped Flow Kinetic Studies
Measurements were made in 10 mm imidazole, pH 7.0, 2 mm MgCl2, 34 mm potassium propionate, 1 mm EGTA, and 1 mm dithiothreitol buffer, using an Applied Photophysics DX17.MV/2 sequential stopped flow spectrofluorometer. The binding of caldesmon to actin was monitored as an increase in light scattering, an increase in fluorescence intensity of the NBD probe on caldesmon, or a decrease in fluorescence of acrylodan-labeled actin upon binding to IANBD-modified caldesmon. IANBD fluorescence was monitored using a filter with 0% transmission at 510 nm and 80% transmission at 540 nm with excitation at 492 nm. Acrylodan fluorescence was monitored with excitation at 391 nm with a filter having 0% transmission at 430 nm and 80% transmission at 500 nm or with a 485–494-nm band-pass filter; both filters produced the same rate constant, but the 500-nm cut-on filter produced the larger signal.
The concentration of caldesmon used was at least 10 times the concentration of binding sites, assuming one caldesmon binds to at least seven actin monomers. Two precautions were used to avoid actin depolymerization in cases where very low actin concentrations were used. Actin was diluted from a 20 μm stock and used for kinetic measurements within 5 min so that appreciable depolymerization would not occur. The same results were obtained using a final actin concentration of 0.5 μm or 2 μm. Alternatively, the actin was treated with a 1.2-fold molar excess of phalloidin added from a 10 mm stock in methanol. Identical results were obtained in the presence and absence of phalloidin. Cytochalasin D (1 mol/100 mol of actin monomer) was sometimes added to the actin when high actin concentrations were used to facilitate mixing. We detected no difference in the traces obtained in the presence and absence of cytochalasin D.
Association rates were measured by mixing IANBD-labeled caldesmon with actin or acrylodan-labeled actin in either the presence or absence of tropomyosin. Averages of up to 15 kinetic measurements were analyzed by fitting equations for a monoexponential or biexponential process to the data with the software provided in the Applied Photophysics package. Caldesmon binds to an actin lattice where a single binding site consists of several actin monomers. In such situations there is a parking problem, that is units consisting of seven free actin monomers are not always available, so binding of caldesmon may require reorganization of existing bound caldesmon molecules. The result is that second order rate constants of the association reaction cannot simply be obtained from the slope of &kobs against free ligand concentration. We therefore analyzed the kinetic data by a Monte Carlo simulation. The binding and dissociation between a caldesmon molecule and a 7-mer actin are assumed to be simple one-step reactions with rate constants k and k′, respectively. The equilibrium constant for the reaction is defined as K = k/k′. Because the value of K can be obtained from equilibrium binding measurements, only one of the rate constants is an adjustable parameter. We assumed that the actins in solution are uniform in length, with M monomers per actin filament. M and k (or k′) are the only adjustable parameters in our simulation.
The simulation of the kinetics of binding of caldesmon to actin was carried out by following the transitions of a single actin filament among its various “states” as a function of time, starting from a bare actin filament at time 0. An actin state is specified not only by the number of bound caldesmon molecules but also by the distribution of the gaps between two neighboring caldesmons. The transition between any two actin states always involves either a binding or a dissociation reaction. Analyses of the equilibrium binding of caldesmon to actin by the equation of McGhee and von Hippel (1974) show that there is a small amount of positive cooperativity, which compensates for the parking problem (Velaz et al., 1989). We neglect this cooperativity between bound caldesmon molecules in this initial kinetic analysis. Because the cooperativity is small, this is a good first approximation (we are working on a more complete model that accounts for the cooperativity). Thus, if the transition between two states involves the binding of a caldesmon to a gap of m empty units between two bound caldesmon molecules on actin, the transition probability can be evaluated as follows: α = (m -6)kCc, where Cc is the concentration of caldesmon in solution. Note that m must be larger than 7 for binding to occur. If the transition involves the desorption of a caldesmon from the actin, the transition probability is simply equal to k′ The number of caldesmon molecules in solution changes when caldesmon binds to (or dissociates from) actin; this causes the caldesmon concentration in solution to change as a function of time during the simulation. The concentration of caldesmon in solution at any given time can be evaluated using the following equation: Cc = Cc° - (n/M)Cα°, where n is the number of total bound caldesmon molecules on the single actin filament and Cα° and Cc° are the initial concentrations of actin monomers and caldesmon molecules, respectively, as prepared in the experiment at time 0.
At any given state, all of the “out-going” transition probabilities can be evaluated and used to calculate the average “occupation time” that the actin will stay in that state as well as to determine which state the system will go to when the next transition occurs. Thus, by following a path of state transitions, a histogram of the total bound caldesmon on actin can be obtained as a function of time (see Fig. 1). A large number of similar histograms were obtained by repeating the simulation with the same set of parameters. The kinetic curve of caldesmon binding was then obtained by averaging over these histograms.
Fig. 1. Example of a typical histogram showing the total number of bound caldesmon molecules on a single actin filament as a function of time during the first (initial) few transitions of a Monte Carlo simulation.
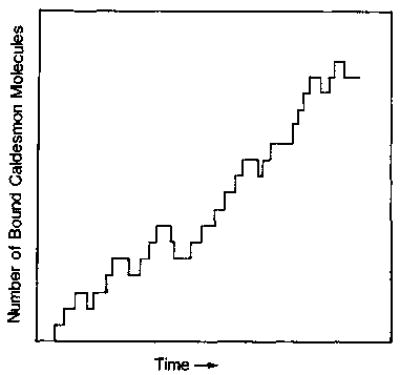
Each transition involves the binding or dissociation of one caldesmon molecule only. Therefore, the number of total bound caldesmon molecules increases or decreases by one.
RESULTS
Light-scattering measurements were not useful for the measurement of unmodified caldesmon binding to actin because the initial binding reaction had a very small signal, while the subsequent slow bundling of actin filaments (caused by the large excess of caldesmon over actin) produced a very large signal. The slow reaction, which was completed in about 20 min, was confirmed as actin filament bundling by electron microscopy (not shown). Large signals were obtained with the binding of NBD-labeled caldesmon to either acrylodan-labeled actin or to native actin. In the former case, the actin probe was observed, while in the latter case caldesmon fluorescence was monitored.
Fig. 2A (curves 1 and 3) shows that the binding of NBD-labeled caldesmon quenched the fluorescence of acrylodan-labeled actin by 37%. The binding of smooth muscle tropomyosin to acrylodan-labeled actin resulted in an 18% increase in fluorescence (curves 3 and 4). The fluorescence of the acrylodan-labeled actin-tropomyosin complex was also greatly quenched by caldesmon-NBD (curves 4 and 2). Fig. 2B shows that S1 also quenched the fluorescence of acrylodan-labeled actin. Thus while the acrylodan-modified actin gave a large signal upon binding to caldesmon, its fluorescence was sensitive to other actin binding proteins.
Fig. 2. Fluorescence emission spectra of NBD-labeled caldesmon and acrylodan-labeled actin.
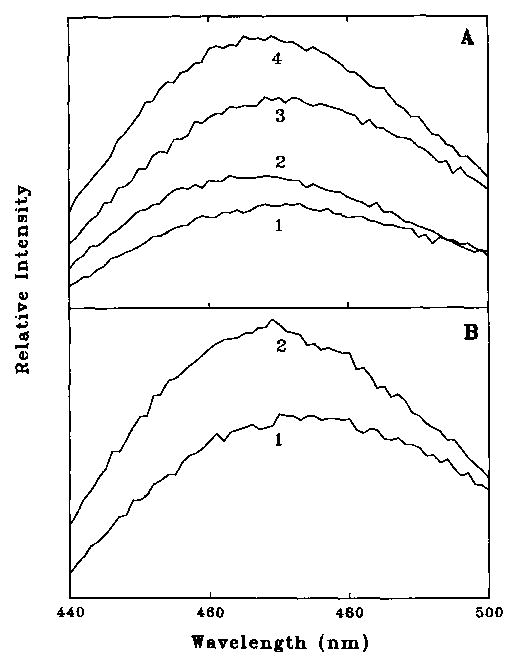
Fluorescence was measured with excitation at 391 nm in a solution containing 10 mm imidazole, pH 7.0, 2 mm MgCl2, 34 mm potassium propionate, 1 mm EGTA, and 1 mm dithiothreitol. A, effect of caldesmon-NBD and S1 on acrylodan actin fluorescence. Curve 3 shows 1 μm acrylodan actin alone, while curve 1 shows the effect of the addition of 1.5 mM caldesmon-NBD. Curve 4 shows 1 μm acrylodan actin and 0.214 μm tropomyosin, while curve 2 shows the effect of addition of 1.5 μm caldesmon-NBD. B, effect of S1 on acrylodan actin fluorescence. Curve 2 shows 1 μm acrylodan actin, and curve 1 shows the effect of the addition of 2 μm S1.
The fluorescence change that occurred when caldesmon-NBD bound to acrylodan-labeled actin was related to the fraction of actin monomers interacting with caldesmon-NBD. Fig. 3 shows the binding curve derived from the decrease in fluorescence of the actin-acrylodan as a function of the added caldesmon-NBD. Analysis of the fluorescence data required the assumption of a stoichiometry of binding. A reasonable fit to the data could be obtained for any value of stoichiometry greater than 1:5; the solid curve shown is for a stoichiometry of 1:7. Two additional parameters describe binding of a large ligand to a lattice. The binding constant for caldesmon binding to an isolated site of seven actin monomers, K, was determined to be 3.2 × 10⁵ m−1. The parameter for cooperativity between adjacent caldesmon molecules, ω, was 17.9. The product Kω is the affinity of caldesmon to a site adjacent to an existing bound caldesmon molecule; this was found to be 5.7 × 10⁶ m−1. In our detailed earlier study, in which the binding was measured by a more direct method, values of K and ω were typically near 6 × 10⁵ and 5–6, respectively, with Kωequal to 3.6 × 10⁶ M−1 (Velaz et al., 1989). This agreement is reasonable and suggests that the fluorescence change is monitoring the binding reaction.
Fig. 3. Fluorescence titration measurement of binding of caldesmon-NBD to acrylodan actin.
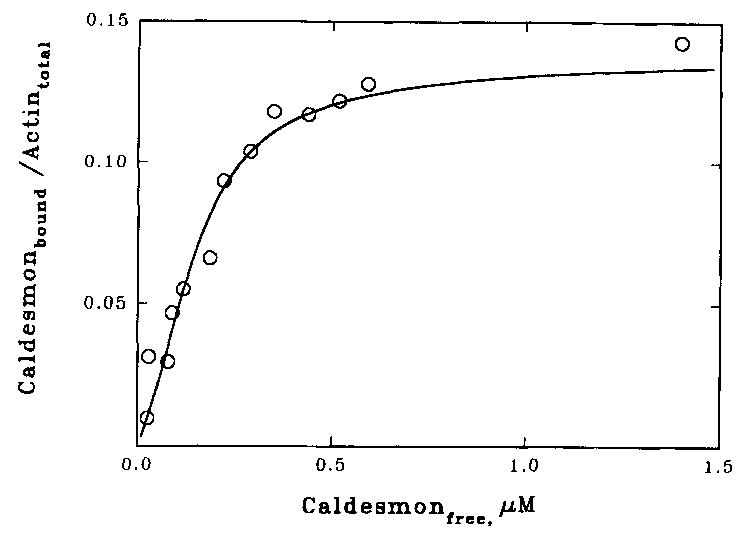
Fluorescence was measured at 15 °C with excitation at 391 nm in the same buffer as in Fig. 2. The fraction of actin containing bound caldesmon was assumed to vary in a linear manner with the fluorescence change. The free caldesmon concentration was calculated assuming a stoichiometry of binding of 1 caldesmon/7 actin monomers. The curve shown is the best fit of the equation of McGhee and von Hippel (1974) to the data. The parameters describing this curve are n = 7, K = 3.2 × 10⁵ M−1, and ω = 17.9.
Fluorescence changes accompanying the binding of IANBD-labeled caldesmon to pure actin are shown in Fig. 4. In Fig. 4A, curves 1 and 4 show that the binding of actin to caldesmon-NBD resulted in a 71% increase in fluorescence intensity and a small blue shift from 546 to 536 nm. The addition of a substoichiometric amount of S1 to the actin-caldesmon complex resulted in a partial reversal of the fluorescence enhancement (curve 2); higher concentrations of S1 totally reversed the fluorescence enhancement. This is consistent with our earlier observation that caldesmon and S1 are competitive with each other for binding to actin. The addition of ATP (curve 3) weakened the binding of S1 to actin and resulted in an increase in fluorescence. This change was time-dependent, and the fluorescence returned to a low value as the ATP was hydrolyzed and the S1 reattached to actin (not shown).
Fig. 4. Fluorescence emission spectra of NBD-labeled caldesmon.
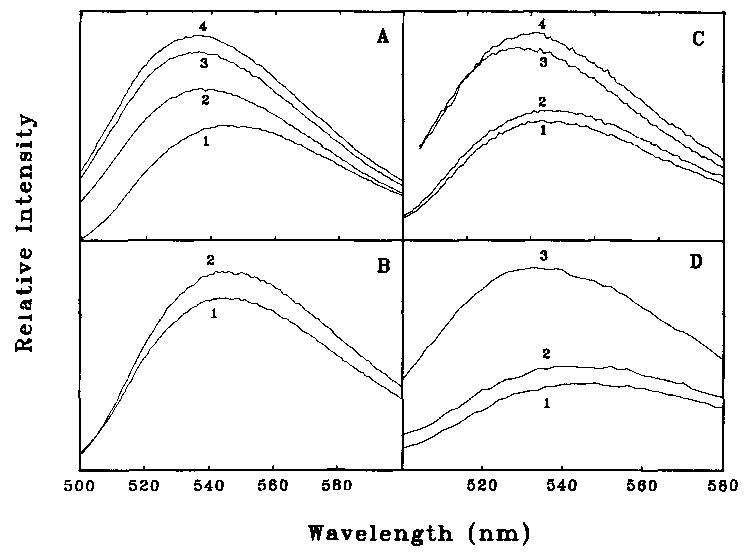
Fluorescence was measured with excitation at 492 nm with the same buffer as used in Fig. 2. A, effect of actin and S1. Caldesmon-NBD (2 μm) is shown in curve 1. The fluorescence increases with the addition of 10 μM actin (curve 4) and decreases again with the further addition of 3.5 μM S1 (curve 2). Dissociation of S1 with 1 mM ATP restores the high fluorescence (curve 3). B, effect of S1 alone. Caldesmon-NBD (1.1 μM) is shown alone (curve 1) and after the addition of 20 μM S1 (curve 2). C, effect of smooth muscle tropomyosin. Caldesmon-NBD (1.2 μM) is shown alone (curve 2) and after the addition of 3.1 μM tropomyosin (curve 1). A mixture of 1.2 μM caldesmon-NBD and 10 μM actin is shown in curve 3; the small fluorescence increase that occurs with the addition of 3.1 μM tropomyosin is shown in curve 4. D, the NBD-labeled 35-kDa, COOH-terminal caldesmon fragment (1.2 μM) is shown in curve 1. The addition of 4 μM actin increases the fluorescence (curve 3), while the further addition of 3.4 μM S1 reverses this increase (curve 2).
Caldesmon binds weakly to S1 (Hemric and Chalovich, 1988). Fig. 4B shows that a small decrease in fluorescence occurred upon the addition of S1 to caldesmon-NBD in the absence of actin. Caldesmon also binds to pure tropomyosin (Graceffa, 1987; Fujii et al, 1988; Watson et al., 1990). Fig. 4C shows that tropomyosin caused a small (8–9%) increase in fluorescence intensity in both the absence (curves 1 and 2) and presence (curves 3 and 4) of actin (Fig. 4C). All of these changes were much smaller than those that occurred when caldesmon-NBD bound to actin.
Since both the NH2 and COOH ends of caldesmon-NBD contained a fluorescent label it was necessary to determine if the observed fluorescence change was due solely to the interaction of the COOH-terminal actin binding region with actin. The COOH- and NH2-terminal polypeptides of IANBD-labeled caldesmon were isolated from chymotryptic digests of the caldesmon. Amino-terminal sequence analysis of the presumptive myosin binding fragment indicated the presence of two polypeptides, Ser26-Tyr-Gln-Arg-Asn-Asp-Asp and Gln28-Arg-Asn-Asp-Asp-Asp, that confirmed that this fragment is from the NH2-terminal region containing Cys153. The addition of actin did not result in a change in the fluorescence of the labeled NH2-terminal fragment.
The 35- and 20-kDa actin binding fragments of caldesmon, which contain only one Cys residue, Cys580, were also purified and found to be fluorescent. Fig. 4D shows that addition of actin to the pure IANBD-labeled 35-kDa caldesmon fragment resulted in a 92% increase in fluorescence (curves 1 and 3). The increase in fluorescence was largely eliminated by the addition of substoichiometric concentrations of S1 (curve 2). Therefore, the change in fluorescence of caldesmon was due to the interaction of the COOH-terminal region of caldesmon with actin.
We had shown earlier that modification of caldesmon with iodoacetamide does not alter its binding to actin or actin tropomyosin (Velaz et al., 1989). Similarly, modification of the two Cys groups of caldesmon with IANBD did not have a measurable effect on the inhibitory activity of caldesmon (data not shown). Similarly, modification of actin with acrylodan had little effect on the ATPase activity (data not shown). For example, at 50 mM ionic strength, smooth muscle tropomyosin enhanced the rate of ATPase activity in the presence of acrylodan actin and absence of caldesmon by a factor of 1.7; this is typical for unmodified actin (Williams et al., 1984). Furthermore, more than twice as much caldesmon was required to give 50% inhibition of the acrylodan actin-activated ATPase activity in the absence of tropomyosin.
The rate of binding of NBD-labeled caldesmon to either actin or acrylodan-labeled actin could be readily observed in a stopped flow apparatus. Fig. 5 shows an example of a reaction using each probe. In the cases shown, the fit was to a monoexponential function. The total fluorescence change was completed within about 50 ms, and no further change occurred at longer time intervals when actin bundles began to form. At higher concentrations of caldesmon, a slightly better fit was obtained with a biexponential fit; this complexity was ignored for this first analysis.
Fig. 5. Rates of fluorescence change for the binding of caldesmon-NBD with actin and acrylodan actin.
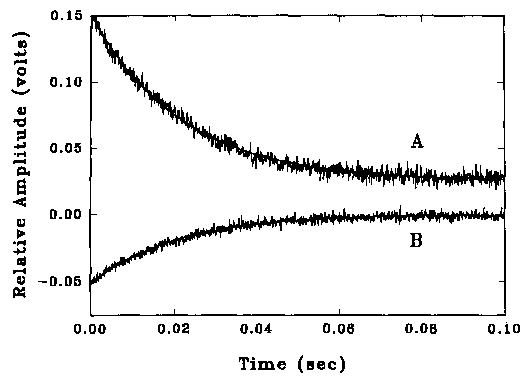
Fluorescence was measured in the same buffer as in Fig. 1 and at 15 °C. Curve A is for binding of 0.5 μM caldesmon-NBD to 0.3 μM acrylodan actin (0.043 μM sites) and shows the decrease in acrylodan fluorescence. The fitted curve is for a rate of 68 s−1. Curve B is for the binding of 0.45 μM caldesmon-NBD to 0.3 μM unmodified actin (0.043 μM sites) and shows the increase in NBD fluorescence. The fitted curve is for a rate of 49 s−1.
The analysis of the rate data to obtain the rate constants k and k′ was done by a Monte Carlo simulation using a simple one-step binding model. For this analysis, we assumed binding constants of caldesmon to actin in the absence and presence of tropomyosin of 0.55 × 10⁶ M−1 and 1.9 × 10⁶ M−1, respectively (Chen and Chalovich, 1992). These binding constants are those to an isolated caldesmon binding site composed of seven actin monomers. The actin lengths assumed in the simulations were M = 700,1400,2800, and 5600. The half-times of the individual reactions were found, in simulations, to be rather insensitive to the actin length. Thus, most of our simulations were based on M = 700 to save computing time.
Although fluorescence changes observed with caldesmon-NBD binding to pure actin reflected changes in the caldesmon probe while binding to acrylodan actin reflected changes in the actin probe, both measurements produced similar kinetic profiles. Fig. 6A shows the dependence on the total caldesmon concentration of the observed half-time values for a single exponential fit to the binding of caldesmon to pure actin. Data obtained by observing the fluorescence of acrylodan actin (squares) were indistinguishable from those obtained by monitoring the caldesmon-NBD fluorescence (circles). The solid curve is the result of the simulation of these data with a single-step model having an association rate constant, k of 1 × 10⁷ M−1 s−1 and a dissociation rate constant, k′, of 18.2 s−1. While this was the best fit of the data, most of the data fell within an envelope bracketed by theoretical curves with association rate constants ranging from 0.8 to 1.2 × 10⁷ M−1 s−1. The simple model used was a good first approximation of the binding.
Fig. 6. Caldesmon concentration dependence of the half-time of binding of caldesmon-NBD to actin (squares) and acrylodan actin (circles) in the absence (A) and presence (B) of smooth muscle tropomyosin.
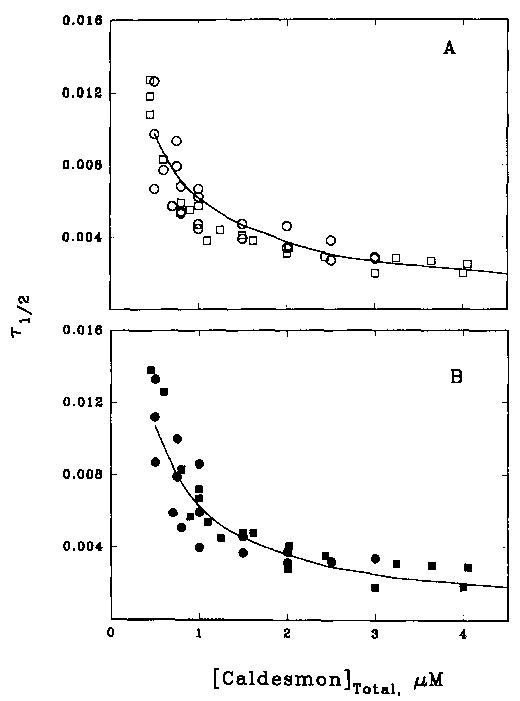
Values of T½ from data such as that shown in Fig. 5 were plotted against the total caldesmon concentration. Binding was measured at 15 °C in the same buffer used in Fig. 2. A, in the absence of tropomyosin, the simulated curve shown is for k = 1 × 10⁷ M−1 s−1 and k′= 18.2 s−1. B, in the presence of smooth muscle tropomyosin the simulated curve shown is for k = 1.2 × 10⁷ M−1 s−1 and k′ = 6.3 s−1.
Fig. 6B shows that the addition of tropomyosin did not greatly alter the observed kinetics of caldesmon binding. The results of experiments done by monitoring acrylodan actin (circles) and caldesmon-NBD (squares) were in close agreement with each other, indicating that the same process was being monitored in each case. The profile of T½ versus caldesmon concentration was quite similar to that obtained in the absence of smooth muscle tropomyosin. The best fit of the simulated data was with an association rate constant of 1.2 × 10⁷ M−1 s−1 and dissociation rate constant of 6.3 s−1, and the data were bracketed by curves generated with association rate constants of 1 and 1.4 × 10⁷ M−1 s−1. Interestingly, the enhanced binding of caldesmon to actin in the presence of tropomyosin appeared to be due primarily to a decrease in the rate constant for caldesmon detachment; the association rate constant was relatively unchanged. The values of k and k′ that generate the best fit of half-times with experimental points are tabulated in Table I.
Table I.
Rate constants for the binding of caldesmon to actin in the presence and absence of tropomyosin
| Addition | k | k′ | K |
|---|---|---|---|
| M−1s−1 | s−1 | M−1 | |
| None | 107 | 18.2 | 5.5 × 10⁵ |
| Tropomyosin | 1.2 × 10⁷ | 6.3 | 1.9 × 10⁶ |
DISCUSSION
Caldesmon-NBD is a useful model for studying the binding of caldesmon to actin. This probe gave a large change in fluorescence upon binding to actin but only small changes upon binding to myosin or tropomyosin, thus indicating a high degree of selectivity. However, observation of this probe on caldesmon had the disadvantage of high background fluorescence when the caldesmon-NBD concentration was high relative to actin. To overcome this difficulty, we have also monitored acrylodan-labeled actin, which is quenched by the NBD probe on caldesmon. Both probes left the steady state kinetics of ATP hydrolysis unaltered, and similar transient kinetic results were obtained regardless of whether the caldesmon probe or actin probe was monitored.
We have shown earlier that the binding of caldesmon to actin is competitive with the binding of S1 in both the presence and absence of tropomyosin (Chalovich et al., 1987; Hemric and Chalovich, 1988; Velaz et al., 1989, 1990; Chen and Chalovich, 1992). In agreement with that result, we now report that the fluorescence change due to caldesmon-NBD binding to actin was reversed by the binding of substoichiometric amounts of S1 to actin both in the presence and absence of tropomyosin. The region of caldesmon that binds to actin and has inhibitory activity is at the COOH-terminal domain of caldesmon (Szpacenko and Dabrowska, 1986; Fujii et al, 1987). This region was also sufficient and necessary for the fluorescence changes reported here.
The binding of caldesmon to actin is probably mechanistically complex because of the parking problem that occurs for binding of a large ligand to a lattice and because of the cooperativity that may exist among adjacent ligands. The data in the present case were analyzed by a Monte Carlo simulation that did not include cooperative effects. The binding constants k and k′ are intrinsic rate constants for the binding to an isolated binding site. Presumably, the true situation consists of a series of rate constants depending on nearest neighbors and on the slower rearrangement of sites to provide total saturation of the actin filament. However, our simple analysis provided a reasonable approximation to the actual event as judged by the close fit of the theoretical curve to the data of Fig. 6. Such a simple analysis would not be expected to be suitable for a more cooperative system such as in the binding of tropomyosin to actin where ω = 1600 (Wegner, 1979). Even in the present case, the inclusion of cooperativity would have given a better fit of the individual reactions run at high caldesmon concentrations where there was a slight deviation from a single exponential. We will include the effect of cooperativity in the future.
Tropomyosin is known to enhance the binding of caldesmon to actin; this enhanced binding appeared, from the present work, to be due to a decrease in the rate constant of dissociation of caldesmon from actin. We did not observe any indication that tropomyosin altered the mechanism of binding, that is the individual time courses of the binding reaction were similar in the presence and absence of tropomyosin; the concentration dependence of the half-times also had a similar appearance. If there were two classes of binding sites for caldesmon, in either the presence or absence of tropomyosin, one might expect to see biexponential binding kinetics even at the lowest caldesmon concentrations used since the caldesmon concentration far exceeded the number of binding sites. In actuality, we observed a good fit to the data with a single exponential curve except at high caldesmon concentrations. While we cannot rule out multiple sites there is no evidence from these data that they exist.
A more telling experiment would be to measure the binding with excess actin over caldesmon. However, this becomes experimentally difficult and computationally nontrivial because several actin monomers constitute a single binding site. Another approach is to measure the dissociation of caldesmon from actin using the same probes described here. However, analysis of this behavior requires Monte Carlo simulations that are different from those presented here. This is a topic of current investigation.
Acknowledgments
We thank Michael Vy-Freedman, Randal Hartwell, Hsiang Chi Guo, and Dan Whitehead for expert technical assistance.
Footnotes
This work was supported by National Institutes of Health Grants AR40540 and AR35216 (to J. M. C.). A preliminary report of this work was presented at the Biophysical Society Meeting, New Orleans, LA, 1994.
The abbreviations used are: S1, myosin subfragment 1; NBD, 12-(N-methyl-N-(7-nitrobenz-2-oxa-l,3-diazol-4-yl)); IANBD, N-((2-(iodoacetoxy)ethyl)-N-methyl)amino-7-nitrobenz-2-oxa-l,3-diazole; caldesmon-NBD, IANBD-labeled caldesmon; acrylodan, 6-aeryloyl-2-di-methylaminonapthalene; actin-acrylodan, acrylodan-labeled actin.
References
- Brenner B, Yu LC, Chalovich JM. Proc Natl Acad Sci USA. 88. 1991:5739–5743. doi: 10.1073/pnas.88.13.5739. [DOI] [PMC free article] [PubMed] [Google Scholar]
- Bretscher A. J Biol Chem. 1984;259:12873–12880. [PubMed] [Google Scholar]
- Chalovich JM, Eisenberg E. J Biol Chem. 1982;257:2432–2437. [PMC free article] [PubMed] [Google Scholar]
- Chalovich JM, Cornelius P, Benson CE. J Biol Chem. 1987;262:5711–5716. [PubMed] [Google Scholar]
- Chalovich JM, Bryan J, Benson CE, Velaz L. J Biol Chem. 1992;267:16644–16650. [PMC free article] [PubMed] [Google Scholar]
- Chen Y, Chalovich JM. Biophys J. 1992;63:1063–1070. doi: 10.1016/S0006-3495(92)81687-9. [DOI] [PMC free article] [PubMed] [Google Scholar]
- Dabrowska R, Goch A, Galazkiewicz B, Osinska H. Biochim Biophys Acta. 1985;842:70–75. doi: 10.1016/0304-4165(85)90295-8. [DOI] [PubMed] [Google Scholar]
- Fujii T, Imai M, Rosenfeld GC, Bryan J. J Biol Chem. 1987;262:2757–2763. [PubMed] [Google Scholar]
- Fujii T, Ozawa J, Ogoma Y, Kondo Y. J Biochem (Tokyo) 1988;104:734–737. doi: 10.1093/oxfordjournals.jbchem.a122542. [DOI] [PubMed] [Google Scholar]
- Graceffa P. FEBS Lett. 1987;218:139–142. doi: 10.1016/0014-5793(87)81034-7. [DOI] [PubMed] [Google Scholar]
- Graceffa P. Biochim Biophys Acta. 1992;1120:205–207. doi: 10.1016/0167-4838(92)90271-e. [DOI] [PubMed] [Google Scholar]
- Hayat, M. A. (1972) Principles and Techniques of Electron Microscopy, Vol. 2, Van Nostrand Reinhold, New York
- Hegmann TE, Schulte DL, Lin JLC, Lin JJC. Cell Motil Cytoskeleton. 1991;20:109–120. doi: 10.1002/cm.970200204. [DOI] [PubMed] [Google Scholar]
- Hemric ME, Chalovich JM. J Biol Chem. 1988;263:1878–1885. [PubMed] [Google Scholar]
- Katsuyama H, Wang CLA, Morgan KG. J Biol Chem. 1992;267:14555–14558. [PubMed] [Google Scholar]
- Marston SB, Redwood CS. J Biol Chem. 1993;268:12317–12320. [PubMed] [Google Scholar]
- McGhee JD, von Hippel PH. J Mol Biol. 1974;86:469–489. doi: 10.1016/0022-2836(74)90031-x. [DOI] [PubMed] [Google Scholar]
- Ngai PK, Walsh MP. Biochem J. 1985;230:695–707. doi: 10.1042/bj2300695. [DOI] [PMC free article] [PubMed] [Google Scholar]
- Pfitzer G, Zeugner C, Troschka M, Chalovich JM. Proc Natl Acad Sci U S A. 1993;90:5904–5908. doi: 10.1073/pnas.90.13.5904. [DOI] [PMC free article] [PubMed] [Google Scholar]
- Prendergast FG, Meyer M, Carlson GL, Iida S, Potter JD. J Biol Chem. 1983;258:7541–7544. [PubMed] [Google Scholar]
- Smith CWJ, Marston SB. FEBS Lett. 1985;184:115–119. doi: 10.1016/0014-5793(85)80665-7. [DOI] [PubMed] [Google Scholar]
- Smith CWJ, Pritchard K, Marston SB. J Biol Chem. 1987;262:116–122. [PubMed] [Google Scholar]
- Sobue K, Takahashi K, Wakabayashi I. Biochem Biophys Res Common. 1985;132:645–651. doi: 10.1016/0006-291x(85)91181-7. [DOI] [PubMed] [Google Scholar]
- Szpacenko A, Dabrowska R. FEBS Lett. 1986;202:182–186. doi: 10.1016/0014-5793(86)80683-4. [DOI] [PubMed] [Google Scholar]
- Trayer HR, Trayer IP. Biochemistry. 1988;27:5718–5727. doi: 10.1021/bi00415a049. [DOI] [PubMed] [Google Scholar]
- Velaz L, Hemric ME, Benson CE, Chalovich JM. J Biol Chem. 1989;264:9602–9610. [PubMed] [Google Scholar]
- Velaz L, Ingraham RH, Chalovich JM. J Biol Chem. 1990;265:2929–2934. [PubMed] [Google Scholar]
- Walker G, Kerrick WGL, Bourguignon YW. J Biol Chem. 1989;264:496–500. [PubMed] [Google Scholar]
- Watson MH, Kuhn AE, Mak AS. Biochim Biophys Acta. 1990;1054:103–113. doi: 10.1016/0167-4889(90)90211-u. [DOI] [PubMed] [Google Scholar]
- Wegner A. J Mol Biol. 1979;131:839–853. doi: 10.1016/0022-2836(79)90204-3. [DOI] [PubMed] [Google Scholar]
- Williams DL, Greene LE, Eisenberg E. Biochemistry. 1984;23:4150–4155. doi: 10.1021/bi00313a022. [DOI] [PubMed] [Google Scholar]
- Yamashiro S, Yamakita Y, Ishikawa R, Matsumura F. Nature. 1990;344:675–678. doi: 10.1038/344675a0. [DOI] [PubMed] [Google Scholar]


