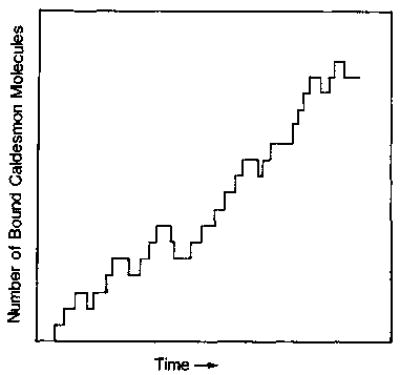
Fig. 1. Example of a typical histogram showing the total number of bound caldesmon molecules on a single actin filament as a function of time during the first (initial) few transitions of a Monte Carlo simulation.

Each transition involves the binding or dissociation of one caldesmon molecule only. Therefore, the number of total bound caldesmon molecules increases or decreases by one.
