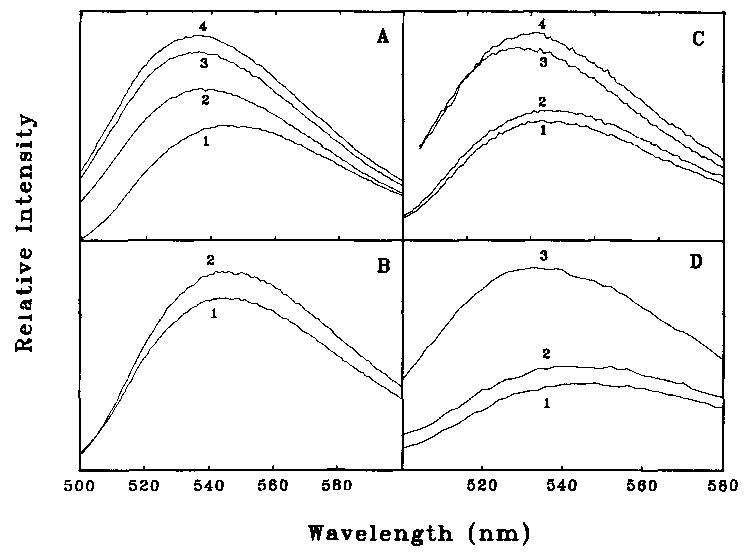
Fig. 4. Fluorescence emission spectra of NBD-labeled caldesmon.

Fluorescence was measured with excitation at 492 nm with the same buffer as used in Fig. 2. A, effect of actin and S1. Caldesmon-NBD (2 μm) is shown in curve 1. The fluorescence increases with the addition of 10 μM actin (curve 4) and decreases again with the further addition of 3.5 μM S1 (curve 2). Dissociation of S1 with 1 mM ATP restores the high fluorescence (curve 3). B, effect of S1 alone. Caldesmon-NBD (1.1 μM) is shown alone (curve 1) and after the addition of 20 μM S1 (curve 2). C, effect of smooth muscle tropomyosin. Caldesmon-NBD (1.2 μM) is shown alone (curve 2) and after the addition of 3.1 μM tropomyosin (curve 1). A mixture of 1.2 μM caldesmon-NBD and 10 μM actin is shown in curve 3; the small fluorescence increase that occurs with the addition of 3.1 μM tropomyosin is shown in curve 4. D, the NBD-labeled 35-kDa, COOH-terminal caldesmon fragment (1.2 μM) is shown in curve 1. The addition of 4 μM actin increases the fluorescence (curve 3), while the further addition of 3.4 μM S1 reverses this increase (curve 2).
