
Supplemental Figure 3.
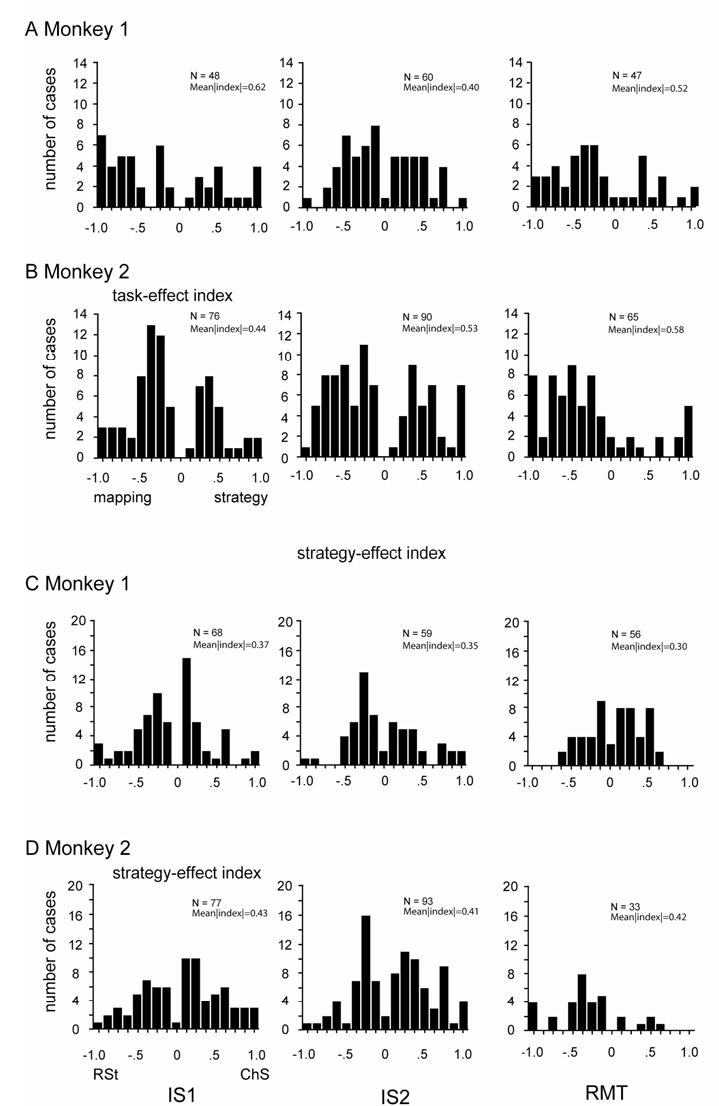
Distribution of Itask across the population of cells for each period. A, B. Frequency distributions for the task-effect index (Itask), for each of three task periods, labeled at bottom. C, D. Frequency distributions for strategy-effect index (Istrat). Abbreviations: IS1, early instruction-stimulus period; IS2, late instruction-stimulus period; RMT, reaction- and movement-time period. Note that the neuronal subpopulation can differ across periods.