
Supplemental Figure 2.
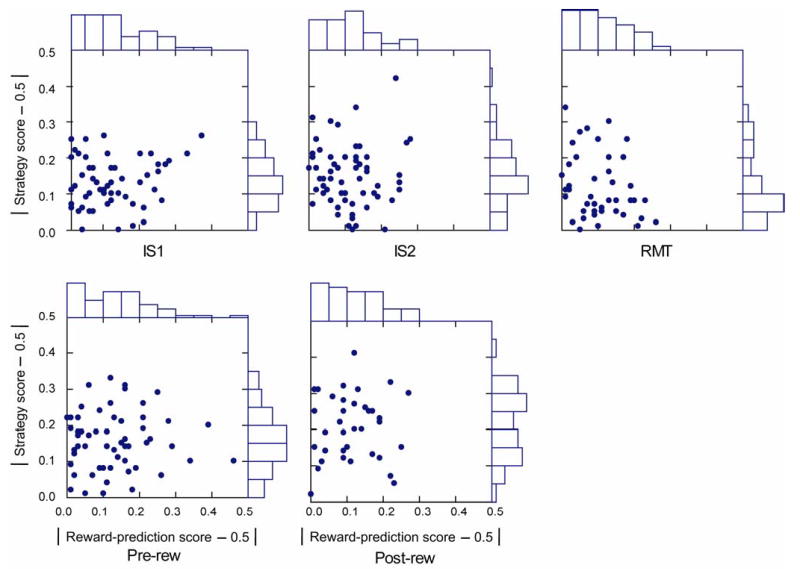
Scatter plots of strategy score and reward-prediction score. Deviation from 0.5, which represents the worst fit to each model. Abbreviations: IS1, early instruction-stimulus period; IS2, late instruction-stimulus period; RMT, reaction- and movement-time period; Pre-rew, pre-reward period; Post-rew, post-reward period.