Figure 4.
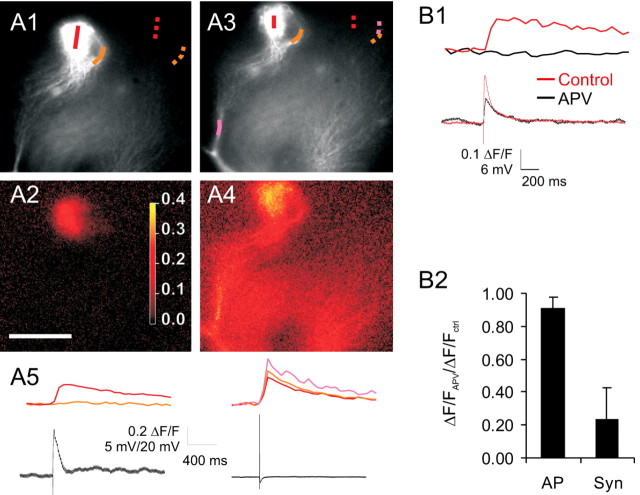
Tuft spikes can cause nonhomogenous activation of tuft branches and are reduced by NMDAR blockade. A1-A4, The top row (A1, A3) shows fluorescence images of tuft of an AOB mitral cell with color map selected to highlight one branch on the right of the tuft (traced by orange line). The bottom row shows ΔF/F image for the associated lines of interest in response to synaptic stimulation (A2) or a backpropagating AP (A4). Note that the right branch shows no measurable calcium transient for the synaptic stimulation (A2), whereas the backpropagating AP elicits a calcium transient in this branch similar to the rest of the tuft (A4). Scale bar: (in A2) 30 μm. A5, Plots of calcium transients across the corresponding lines of interest (colored lines; A1, A3) and simultaneously recorded voltage traces (black lines) during synaptic stimulation and somatically evoked single APs. B1, Tuft calcium transients (top traces) and simultaneously recorded voltage traces (bottom) from this same cell show reduction by APV. B2, Group data from six neurons in which APV was added to an isolated tuft calcium transient, showing that APV reduced but did not eliminate tuft calcium transients. Syn, Synaptic. Error bars represent SEM.

