
Fig. 2. Effects of endothelin-1 on the DAMGO elicited mu opioid response mediated by functional heteromultimers and homomers of Kir3 expressed in Xenopus oocytes.
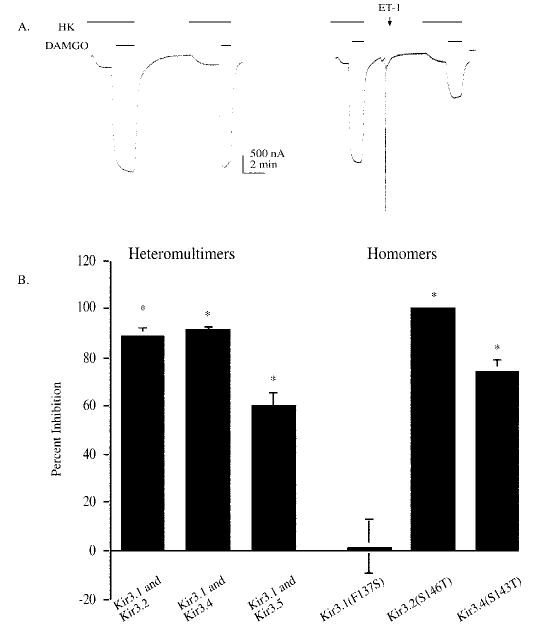
Oocytes were injected with a mixture of the following cRNAs: MOR (1 ng), HETAR (1 ng), and 0.05–1 ng of the Kir subunits listed below the bar. A, representative current traces from oocytes stimulated by perfusion with the mu opioid agonist (1 μm) DAMGO in oocyte buffer containing 96 mm KCl in two applications. Oocytes receiving a second application of 1 μm DAMGO showed a similar response to DAMGO; the amplitude of the second opioid response was 99 ± 2.9% (n = 34) of the first response. The left panel shows the response without Et-1. The right panel includes a pulse of Et-1 (50 nm) in ND96 applied directly to the oocyte in the recording chamber. When endothelin was applied after the first DAMGO application, there was a robust inhibition of the second DAMGO-evoked response (right trace). Application of vehicle had no effect, and the responses to endothelin were absent in oocytes not expressing the receptor. For these traces, oocytes were clamped at −80 mV in normal saline buffer. Horizontal bars indicate the duration of drug perfusion. The opioid response was only observed in oocytes injected with both receptor and channel cRNA. The endothelin-induced activation of the endogenous chloride current (24, 33) was only observed in oocytes injected with the endothelin A receptor cRNA. Horizontal bars indicate the duration of drug perfusion. The opioid response was only observed in oocytes injected with both receptor and channel cRNA. The endothelin-induced activation of the endogenous chloride current (24, 33) was only observed in oocytes injected with the endothelin A receptor cRNA. B, the percent inhibition of the second opioid receptor response is compared with the first response. Bars represent mean ± S.E. of 18–20 oocytes from three batches. Recordings were performed 2–3 days post-injection. Oocytes used were injected with MOR, HETAR, and the Kir3 cRNA listed on the x axis.