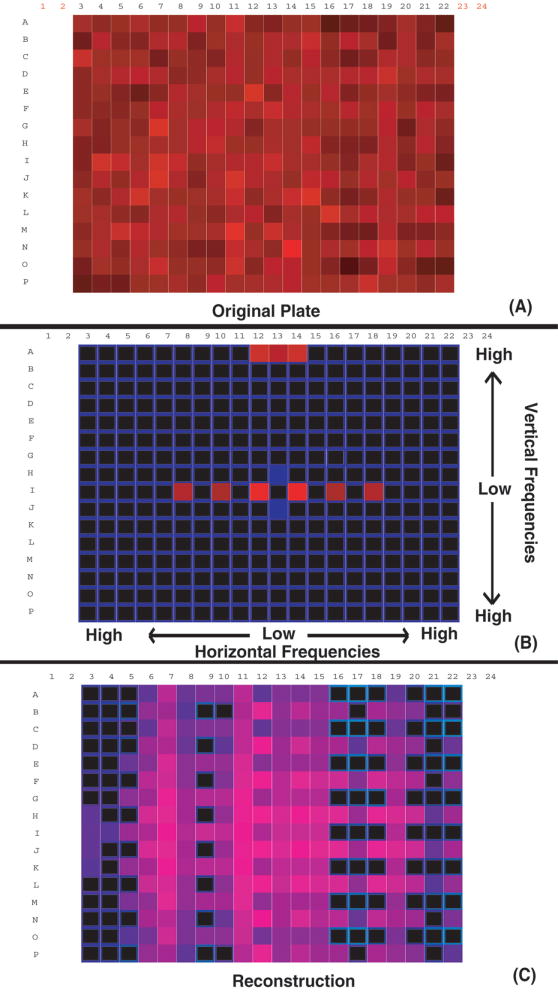
FIG. 2.
Microplate with systematic error (A) and a histogram of the corresponding periodogram amplitudes (B). Panel (C) shows a periodogram derived from random uncorrelated data with the same mean and standard deviation as the experimental data. In comparison, the highest amplitude outlier of the periodogram in (B) is 13.6 standard deviations above the mean highest periodogram amplitude generated from a series of 100 random plates, which indicates that the probability of (A) being a random plate is essentially zero. Panel (D) shows the inverse transform of just the indicated high-amplitude outliers from the periodogram, yielding a reconstructed image of the data array containing only the overrepresented patterns.

