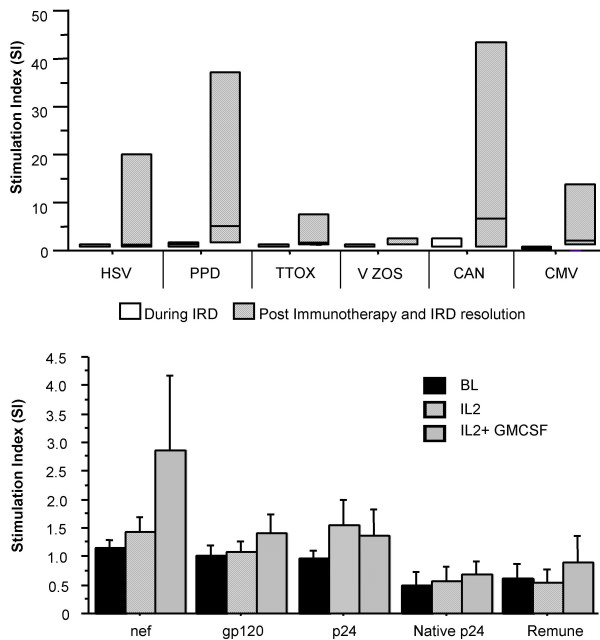
Figure 1.
(a – top) Lymphoproliferative responses to a panel of recall antigens in IRIS patients during IRIS manifestation and post remission. Open bars denote T cell responses during IRIS manifestation and hatched bars represent T cell responses after immunotherapy with IL-2 plus GM-CSF in conjunction with ART and resolution of IRIS. Data are shown as median SI values with interquartile ranges. X-axis depicts the recall antigens tested. (b- bottom) HIV-1-specific lymphoproliferative responses in IRIS patients. Data depicted are before immunotherapy (solid bars), 4 weeks after IL-2 administration (crossed bars) and 4 weeks after IL-2 plus GM-CSF (hatched bars). Data are shown as median values with interquartile ranges.

