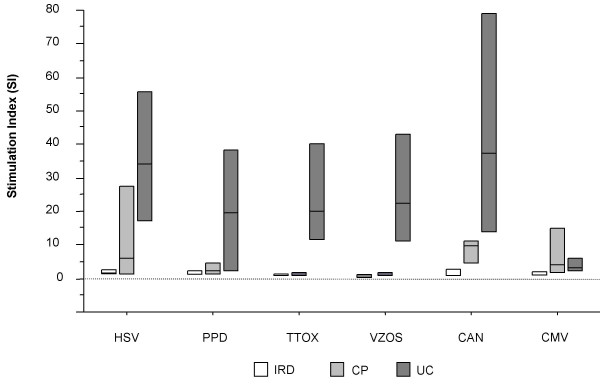
Figure 4.
Box-plots depicting specific lymphoproliferative responses to different recall antigens, during manifestation of IRIS and comparison with clinical progressors with no IRIS and uninfected controls. The antigens used are shown on the x-axis. Bars denote median responses with interquartile ranges. White boxplots represent IRIS patients receiving ART and immunotherapy. Non-IRIS patients are depicted by dotted boxplots and uninfected controls by hatched boxplots.

