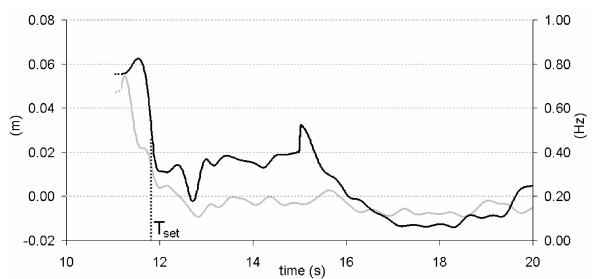
Figure 1.
Acquired data. A sample of time histories for the Centre of Pressure trajectory in Antero-Posterior direction (CoPAP, light gray), and instantaneous mean frequency extracted from CoPAP. The settling time Tset is also shown (black dotted line). All the Posturographic Parameters were calculated over the time period [Tset, Tset +30].

