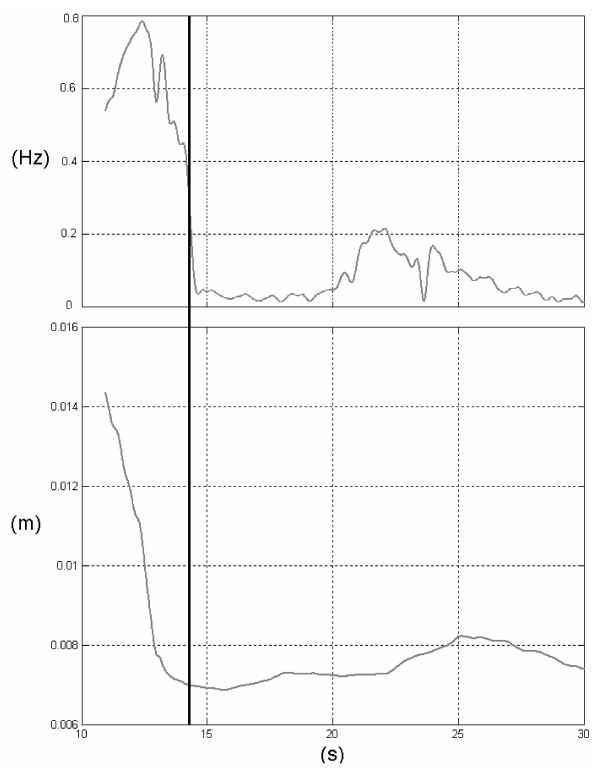
Figure 2.
Instantaneous Mean Frequency. A sample of time history for the Instantaneous Mean Frequency for the Centre of Pressure Antero-Posterior (upper panel), and the Mean Amplitude value, as calculated by using 30 s starting from the corresponding time instant (lower panel). The settling time Tset used for the actual parameter estimation is also shown (black vertical line).

