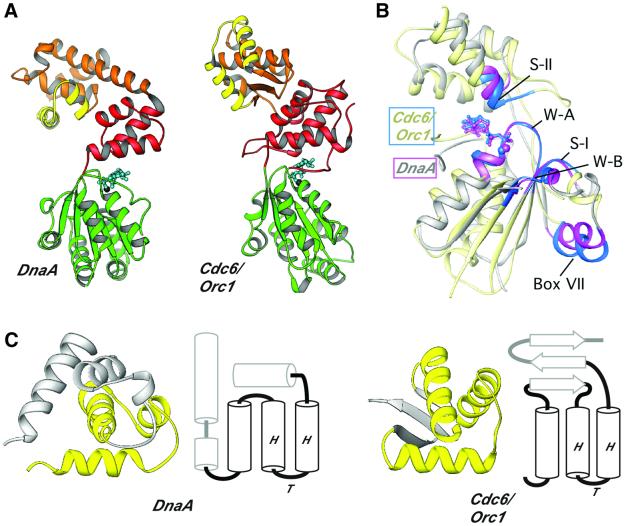
Fig. 6. Structural comparison of DnaA and Cdc6/Orc1. (A) RIBBONS diagrams of DnaA and its closest structural homolog, Cdc6/Orc1. Domains are labeled as in Figure 2A, except that the HTH motifs are highlighted in yellow. (B) RIBBONS diagram superimposing the AAA+ regions of DnaA (light gray) and Cdc6/Orc1 (pale yellow). Elements critical for the spatial conservation of the bipartite ATP-interaction cleft are highlighted in magenta (DnaA) and blue (Cdc6/Orc1). The two proteins exhibit an r.m.s.d. of 2.3 Å across 139 of the 213 Cα residues that are present in core secondary structure elements. (C) Comparisons of DnaA and Cdc6/Orc1 OLEs. The RIBBONS diagram shows the related HTH topology (in yellow) of the C-terminal modules next to secondary structure topology diagrams that indicate how the HTH motif is anchored within each C-terminal fold. Secondary structure comparisons were performed using the sequential structure alignment program SSAP (Orengo and Taylor, 1996).

An official website of the United States government
Here's how you know
Official websites use .gov
A
.gov website belongs to an official
government organization in the United States.
Secure .gov websites use HTTPS
A lock (
) or https:// means you've safely
connected to the .gov website. Share sensitive
information only on official, secure websites.
