

Abstract
The undocumented immigrant population in the United States is aging and diversifying by origin group. However, research on aging among undocumented immigrants focuses on Mexicans and Central Americans, even as this population declines, and less is known about other groups. We analyze residual estimates of the undocumented population and the 2018-2022 panels of the Survey of Income and Program Participation to document trends in age at arrival, duration in undocumented status, and socioeconomic and health correlates for undocumented immigrants across 27 countries or regions. We find dramatic increases in the older undocumented population across all origin groups, especially among those from Asia, the Caribbean, Europe, Canada, and Oceania. Aging in place drives population aging among the largest groups, those from Mexico, Central America, Venezuela, and India, while both aging in place and increases in arrivals at older ages are responsible for population aging among those from other origins. Additionally, undocumented status for older immigrants from most origins is associated with significant socioeconomic disadvantage regardless of age at arrival, but especially for those who age in place. This foreshadows rising inequality by legal status among America’s seniors as the most disadvantaged immigrant groups age in place in coming decades.
The older undocumented population in the United States has grown in the past two decades. In 2005, just over 10 percent of the undocumented population was over age 40, with almost none over the age of 65 (Passel, 2005). Although consistent age comparisons are unavailable in published work, growth is evident: by 2018, 25 percent of the undocumented population was over the age of 45, including 9 percent 55 and older (Capps et al., 2020). We show here that the undocumented population is likely to continue to age into the future while diversifying across origin groups with respect to age at arrival and expected duration spent in undocumented status. These patterns in timing and duration are important because they determine which stages of life undocumented immigrants live in the U.S. and have implications for the well-being of immigrants themselves and their family members. Existing research on the population dynamics of the older undocumented immigrant population in the U.S. has focused on the Latino population (Ro et al., 2022). Yet, over the last decade, the undocumented population has expanded to include a broader range of origins (Van Hook, et al., 2023). It is critical to understand the aging profiles of this newly diversifying population.
Until 2015 the majority of undocumented immigrants in the United States originated from Mexico (Passel & Krogstad, 2023). This migration stream was initially characterized by a high degree of circularity, meaning that undocumented individuals were less likely to remain in the United States into older ages. Because of policy changes in the 1990s and 2000s, the costs and risks associated with undocumented migration increased, and this, in turn, curtailed return migration, leading to longer durations of stay (Massey et al., 2015). The Great Recession in the mid-2000s reduced both in-migration of younger Mexican undocumented immigrants to the U.S. and further reduced return migration among the population already in the U.S. (Rendall et al., 2011). Altogether, a large portion of the Mexican undocumented population in the U.S. has “aged in place” and are less likely to be replenished by an influx of younger immigrants.
The changing age composition of the undocumented immigrant population in the U.S. is also driven by a shift in region or country of origin composition. Over the last decade and a half, the share of the undocumented population from Mexico has declined and a wider range of origins are represented among the undocumented (Van Hook, et al., 2023). Each origin group has unique factors impacting migratory patterns, including age distribution at migration, duration of time spent in undocumented status, pathways to legalization, and propensity for return migration. For example, there has been an increase in undocumented immigrants from Central America and Venezuela fleeing adverse humanitarian and economic conditions (Massey, 2020). These undocumented individuals are less likely to return voluntarily and, therefore, likely to contribute to a growing population “aging in place.” On the other hand, some origin groups are characterized by a high rate of undocumented migration at older ages. We speculate that many individuals who migrate in older adulthood do so to reunify with family members, seeking the support of adult children who migrated before them, or to provide caregiving for their grandchildren.
Migration patterns such as age at arrival and duration in undocumented status have implications for the wellbeing of immigrants themselves and their family members. Existing research is focused on the general immigrant population, and it is unclear how outcomes may differ for undocumented immigrants. In terms of social mobility, longer duration and/or earlier age at arrival is usually thought to be related to better socioeconomic outcomes, with immigrants’ income increasing with time in the U.S. labor market (Duleep et al., 2022). On one hand, there is evidence that this wage growth may not occur for undocumented immigrants who do not have legal work permits and therefore do not have access to the same wage structure and legal protections as immigrants with legal status (Hall et al., 2010). On the other hand, there is evidence that immigrants with low educational attainment, which is overrepresented among the undocumented, may experience wage growth with time in the US due to selective return migration: individuals who are unable to secure jobs may return to their country of origin (Kaushal et al., 2016). Among the overall immigrant population, previous research finds that disparities in lifetime earnings and job benefits contribute to reverse economic assimilation in older adulthood (Ye, 2024). This may be extenuated for older undocumented immigrants due to exclusion from universal social welfare programs like Social Security and Medicare, that historically increased older adult socioeconomic wellbeing and health status (Morales, 2021).
The relationship between health and duration and/or age at arrival is less certain than social mobility, even among the general immigrant population (Markides & Rote, 2019). For undocumented immigrants, health may deteriorate more quickly over time because of exposure to heightened stress, limited health insurance coverage and preventative health care, and vulnerability to hazardous work conditions due to employment in an unregulated labor market (Cheong & Massey, 2019). It is also unclear how return migration plays a role in the health status of the general population of older immigrants: among Mexican immigrants fewer activities of daily living (ADL) limitations are associated with return migration (Sheftel, 2024), but more health limitations and greater stress are associated with a greater likelihood of return, and there is limited evidence of health selective return for chronic conditions or self-reported health (Diaz et al., 2016). With mixed evidence of the direction of potential health selective return, it is difficult to predict how return migration may differ by legal status.
Existing research on the population dynamics of the older undocumented immigrant population in the U.S. focuses on the Latino population (Ro et al., 2022). Since the share of the undocumented population from Mexico and Central America has decreased in the last 15 years and that from most other regions around the globe has increased (Van Hook, et al., 2023), it is critical to understand the underlying population dynamics and migration patterns of a more diverse set of countries and regions of origin. This paper fills this gap by documenting age at arrival, duration in undocumented status, and socioeconomic and health correlates of these migratory patterns across 27 countries or regions.
Methods
Data on Undocumented Immigrants
To assess the aging of the undocumented immigrant population, we first created estimates using the longstanding residual method1. Briefly, the method generates estimates of the aggregate number of undocumented immigrants by age, sex, year of birth, year of entry and by country or region of birth for 27 different countries or regions. The estimates are made by subtracting the number of immigrants with a legal status from the total number of immigrants in 2000–2023 U.S. Census Bureau American Community Survey (ACS) data (Ruggles et al., 2022).
We classify foreign-born individuals as having legal status if they (a) were admitted with Lawful Permanent Residence (LPR) since 1982 (including naturalized citizens); (b) were approved to enter with a humanitarian status but have not yet adjusted to LPR; (c) are nonimmigrants on work or student visas (e.g., international students, H-1B high-skilled workers, and H-2A agricultural workers); (d) or if they entered the country before 19822. Nonimmigrants (group c) can be identified indirectly based on their characteristics in the ACS, and pre-1982 arrivals (group d) can be identified directly. The numbers of individuals with an LPR status (group a) or with a humanitarian status (group b) are estimated by totaling all legal admissions in every year since 1982—using U.S. Department of Homeland Security (DHS) and State Department administrative records—and then reducing these numbers to account for deaths and emigration (Leach, 2017; Schwabish, 2011) of those individuals.
We estimate the number of undocumented immigrants by subtracting the number of immigrants with a legal status from the total number of immigrants in the ACS (Ruggles et al., 2022), and then adjust the estimates upward to account for undercount of undocumented immigrants in the ACS. We also smooth the estimates across years within entry cohorts to account for heaping in year-of-arrival reporting. The resulting estimates include those who entered the country without inspection and those who arrived with a temporary visa (e.g., student visa) but overstayed or otherwise violated the terms of their visa. They also include a rapidly growing group of individuals with “liminal” status who received an official, temporary reprieve from deportation but whose status could easily be revoked: individuals with TPS, DACA, parole, and those with pending asylum applications. Additional details on the methodology used to estimate the number of undocumented immigrants is included in Appendix 1.
Aging Among Undocumented Immigrants
The residual estimates just described are counts of the undocumented immigrant population for each birth and entry cohort for 27 different countries or regions, for each year from 2000 to 20233. These data permit us to directly estimate the age composition of undocumented immigrants. For example, the share age 50 or older is simply the number age 50 or older divided by the total undocumented population.
We also used the data, together with life table methods, to model age at arrival and the expected share that will age in place. We originally developed these methods to examine the dynamics and demographic impact of the unauthorized foreign-born population (Van Hook, 2024), but we apply them here to examine population aging. The methodology involves: (a) estimating the annual components of change (inflow, death and outflows) by country/region of birth, age, sex, and duration, (b) using the components of change to produce life tables by country/region, age-at-arrival, and sex, and (c) using the life tables to produce estimates of older age at arrival and aging-in-place.
a). Components of Change.
To estimate the components of change for the undocumented foreign-born population, we reshaped the residual estimates data into birth- and entry-cohorts for each country/region of birth, whereby each cohort is followed over time from 2000 (or the year of entry of the cohort if it arrived after 2000) to 2023. For groups with few visa overstayers, entry cohorts typically grow quickly in their first year in the country, signifying the entry of new arrivals, as shown in Figure 1a for Mexicans who arrived in 2005. The cohort declined starting around the 2nd year of residence. The pattern differs for groups with large numbers of visa overstayers. Visa overstayers originally enter the country legally on nonimmigrant visas but fall out of status later, typically after 6 to 8 years. This is depicted for Indians who arrived in 2005 in Figure 1b. From the 1st to the 9th year, the cohort grew slowly as visa overstayers joined the undocumented immigrant population. After the 9th year, the cohort declined as members died, legalized, or moved away.
Figure 1a.
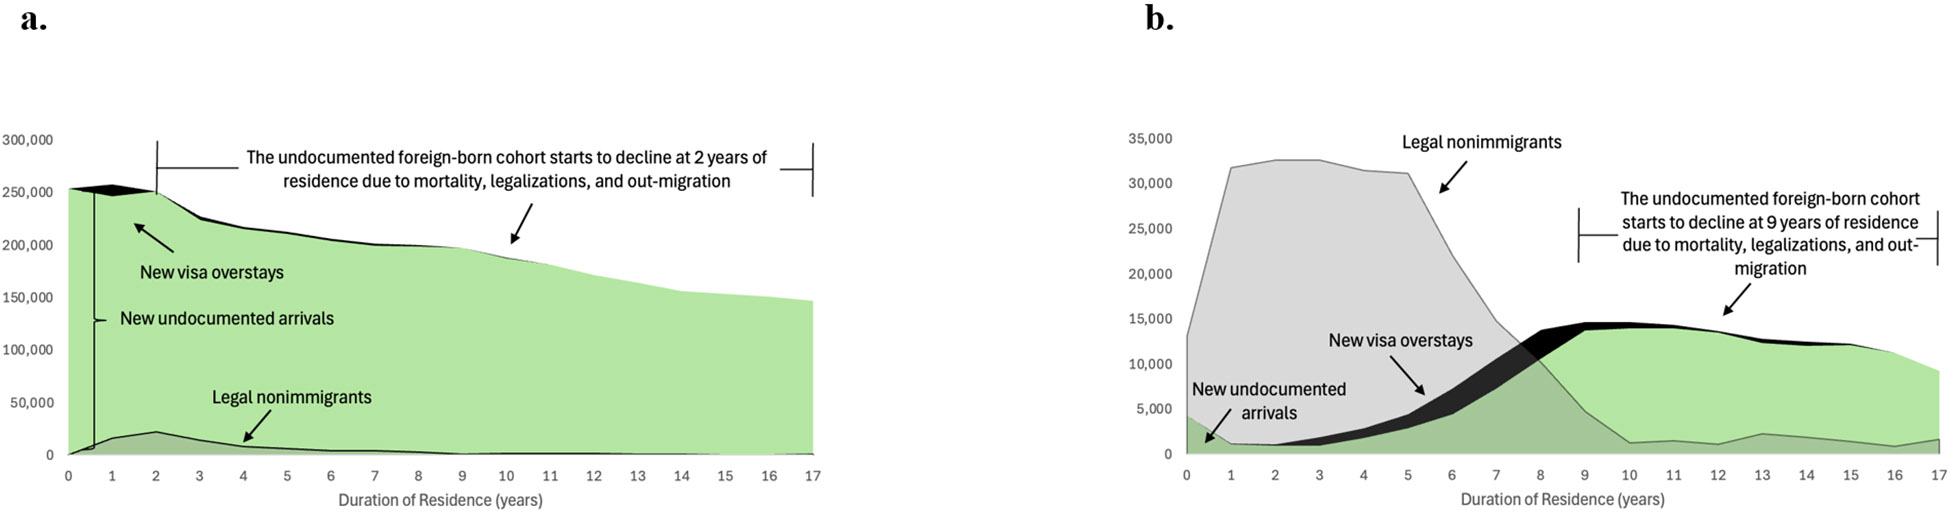
Cohort Change Among an Undocumented Group With Few Visa Overstayers: Mexican 2005 Arrivals Aged 15-29
Figure 1b. Cohort Change Among an Undocumented Group With Many Visa Overstayers: Indian 2005 Arrivals Aged 15-29
We analyzed changes in the size of each birth- and year-of-entry-cohort to infer the components of change: i.e., entries and exits. Entries into the undocumented population include new arrivals and likely visa overstays. We estimated the number of new arrivals as the growth in the size of the cohort during its first full year in the country, and the number of likely visa overstays as the additional positive growth in the cohort (after accounting for deaths) between its 2nd and 10th year in the country. If there was no additional growth in the cohort (i.e., the cohort declined), the number of visa overstays was assumed to be zero. Conversely, if the additional growth was greater than our ACS-based estimate of visa overstayers for the group4, we reduced the estimate to match the ACS-based estimate.5 Exits from the population included deaths, legalizations, and return migration. We estimated the number of deaths by multiplying the number of person-years lived in each cohort by age- and sex-specific foreign-born death rates (see Appendix 1). Note that deaths make up only a small share (6%) of the total outflows from 2000 to 2023. We did not have enough information to separate legalization from return migration, so we combined them into a single indicator, net outflows, which were estimated as total net growth + deaths − new arrivals − visa overstays. Each component of change was expressed as a rate by dividing by the mid-year population size.
b). Lifetables.
We used the components of change estimates to create lifetables. The lifetables model the decline in the size of a synthetic cohort from entry into undocumented status until death, legalization, or return migration if it experienced all current age- and duration-specific death and outflow rates. As an illustration, Table 1 shows the lifetable for male Mexican immigrants who arrived at age 20–24, constructed from death and outflow rates averaged over the five-year period between 2015 and 2022. As shown in the first and second columns, each cohort enters the lifetable at their age at arrival. For simplicity, all are assumed to enter the country at the beginning of the age-at-entry category, and the cohorts are then followed over time as they age (Column 1) and spend more time in the United States (Column 2). New arrivals are added to the cohort in the first year of U.S. residence (Column 3), while visa overstayers are added in subsequent years (Column 4). Each cohort (Column 6) initially grows as new arrivals and visa overstayers are added but then declines as some members die (Column 7) or leave the undocumented population due to legalization or out-migration (Column 8). Finally, columns 9–12 concern the expected duration lived by the cohort in undocumented status:
Table 1. Example life table of time lived in undocumented status by Mexican male immigrants who arrived at age 20, 2015–2022.
| Entries into Undocumented Status (1,000s) |
Outflows | |||||||||
|---|---|---|---|---|---|---|---|---|---|---|
| (1) Age x |
(2) Duration |
(3) New Arrivals, |
(4) Overstay temp. visa, |
(5) All entries |
(6) Number in Unauthorized Status, |
(7) Deaths, |
(8) Other outflows, |
(9) PYs lived in interval, |
(10) PYs lived age , |
(11) Ave. PYs in undoc status, |
| Mexican Male Immigrants, arrived age 20 | ||||||||||
| 20 | 0 | 55.8 | --- | 55.8 | 55.8 | 0.1 | 6.2 | 58 | 1584 | 23.1 |
| 21 | 1 | --- | 10.8 | 10.8 | 60.4 | 0.3 | 1.1 | 241 | 1526 | |
| 25 | 5 | --- | 1.3 | 1.3 | 60.2 | 0.4 | 13.8 | 268 | 1285 | |
| 30 | 10 | --- | 0.7 | 0.7 | 46.8 | 0.4 | 6.3 | 217 | 1017 | |
| 35 | 15 | --- | --- | --- | 40.1 | 0.4 | 6.2 | 184 | 800 | |
| 40 | 20 | --- | --- | --- | 33.5 | 0.5 | 7.7 | 147 | 616 | |
| 45 | 25 | --- | --- | --- | 25.3 | 0.6 | 3.1 | 118 | 468 | |
| 50 | 30 | --- | --- | --- | 21.7 | 0.6 | 6.5 | 91 | 351 | |
| 55 | 35 | --- | --- | --- | 14.6 | 0.7 | 0.9 | 69 | 260 | |
| 60 | 40 | --- | --- | --- | 13.0 | 0.9 | 1.0 | 60 | 191 | |
| 65 | 45 | --- | --- | --- | 11.1 | 1.0 | 1.6 | 49 | 131 | |
| 70 | 50 | --- | --- | --- | 8.4 | 1.2 | 1.2 | 36 | 82 | |
| 75 | 55 | --- | --- | --- | 6.1 | 1.3 | 0.8 | 25 | 46 | |
| 80 | 60 | --- | --- | --- | 3.9 | 1.6 | 0.5 | 15 | 21 | |
| 85 | 65 | --- | --- | --- | 1.9 | 1.9 | 0.0 | 6 | 6 | |
| Total Entries | 55.8 | 12.7 | 68.5 | |||||||
c). Older Age at arrival and Aging-in-place.
Finally, we used the elements of the life tables to estimate measures of population aging. The share of undocumented entries who arrived at age 50 or older is obtained by dividing the number of entrants whose age at arrival is 50 or older by the total number of entrants:
The share of entrants who are likely to age in place is obtained by dividing the number of entrants who aged into the 50+ age category by the total number of entrants:
We produced the lifetable aging measures separately by gender and five-year age-at-arrival groupings, and then averaged them, while weighting on cohort size, to create summary statistics for each country/region grouping. Many of our measures require estimates of population change from one year to the next, so our results pertain to the 2000–2001 to the 2022–2023 periods (i.e., 2000–2022).
To account for ACS sampling error, we estimated bootstrapped standard errors for all estimates across 500 iterations. The standard error of the estimates is the standard deviation across all iterations.
Characteristics of Older Undocumented Immigrants
We relied on the 2018–2022 panels of the Survey of Income and Program Participation to estimate the average years of schooling, poverty rate, and percentage with at least one functional limitation of the likely undocumented and likely documented foreign-born persons aged 50 and older. Likely undocumented immigrants were identified as noncitizens who reported that they did not arrive as a legal immigrant. We label this group as “likely” undocumented to acknowledge response and coverage error. Undocumented immigrants who participate in surveys are likely to be more integrated into U.S. society and have higher levels of education, lower poverty rates, and better health than nonparticipants. Therefore, our estimates provide conservative estimates of older undocumented immigrants’ disadvantages.
Because of SIPP’s sparse sample sizes, we used combined-sample-multiple-imputation (CMSI) to increase statistical power (Capps et al., 2018), whereby we pooled the five-year 2022 ACS (i.e., 2018–2022) with the SIPP data and multiply imputed documentation status for noncitizens aged 50+ in the ACS (N = 876,620). Under conditions met here6, CMSI has been shown to yield unbiased estimates of the characteristics of undocumented immigrants.
Results
Recent Trends in Population Aging
Over the past two decades, the undocumented immigrant population has become older across all regions of origin. Figure 2a depicts the share of all undocumented immigrants that are age 50 and older by region of origin. For comparison, we plot Mexico separately. The bold black line shows that the percent of all undocumented immigrants that are age 50 and older increased from about 3 percent in 2000 to 23 percent in 2022. The change over the past 20 years varies widely across regions. For example, in 2000 the percent of undocumented immigrants 50 and older among those from Africa and Central America was close to zero and by 2022 it was about 12 and 9 percent, respectively. Those 50 and older made up a greater portion of the undocumented from South America (6%), Asia (6%) and the Caribbean (9%) already in 2000, and by 2022 the share increased to about a quarter among those from South America (23%) and close to a half for those from Asia (48%) and the Caribbean (40%). A considerable portion (18%) of undocumented immigrants from Europe, Canada, and Oceania were age 50 or older in 2000 and this group grew to over 50 percent by 2022.
Figure 2a.
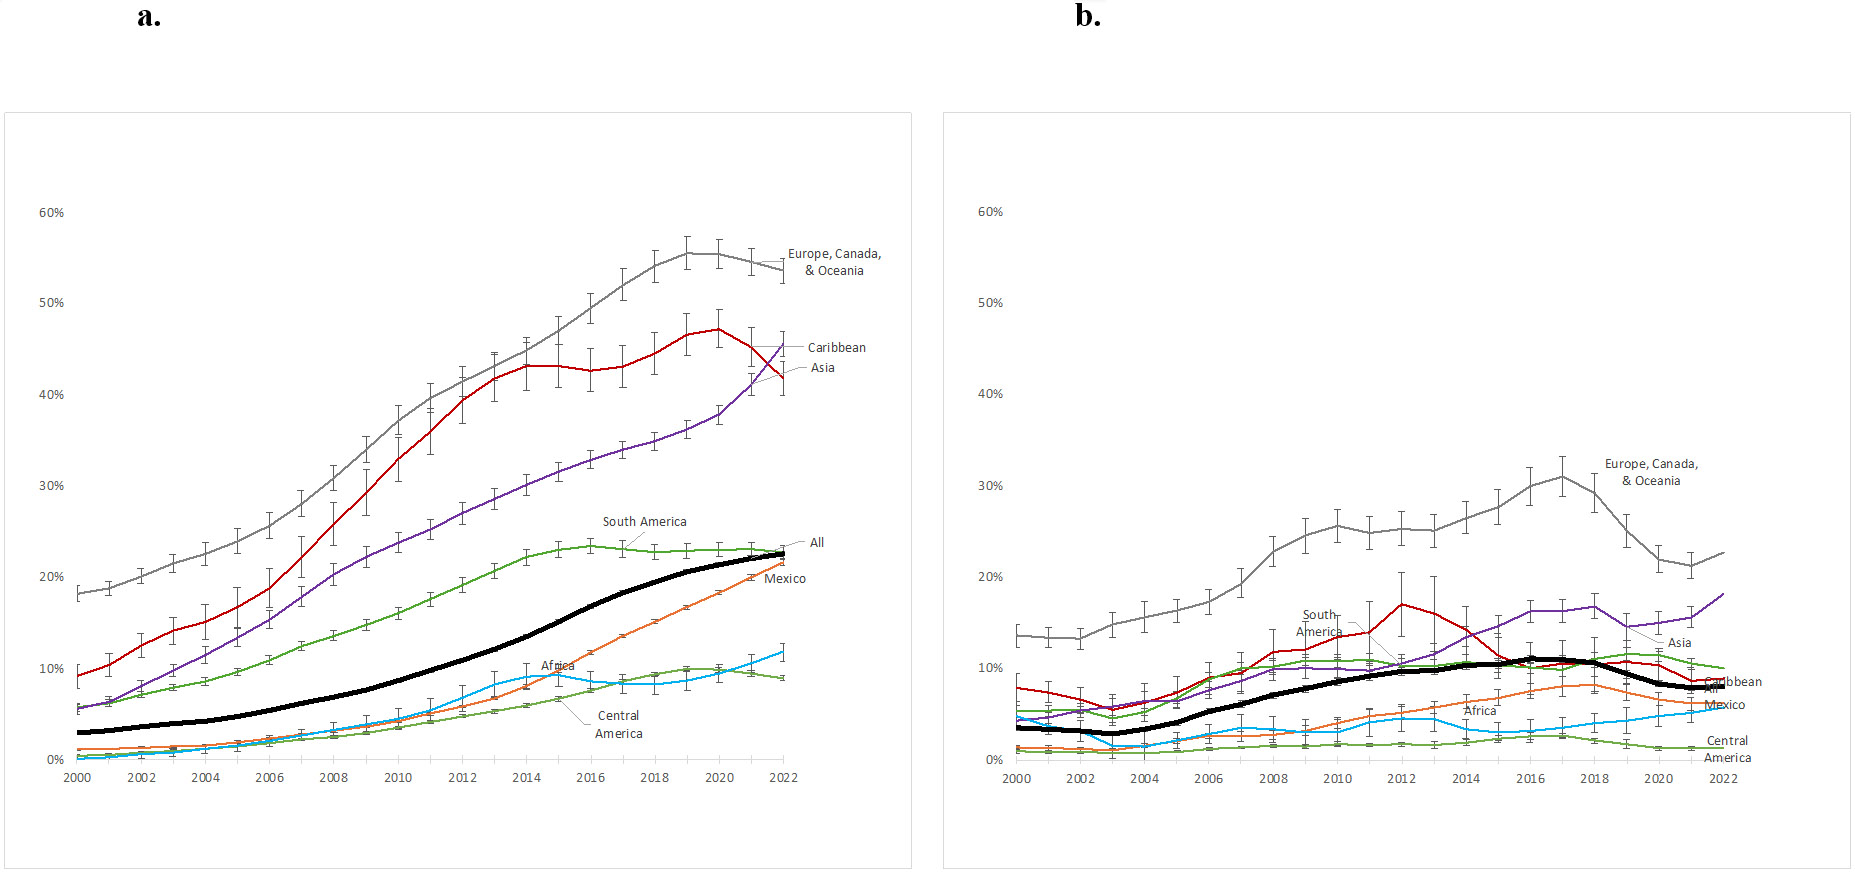
Percentage of Total Undocumented Immigrants that are Age 50+ by Region of Origin, 2000-2022 (3-year moving averages)
Figure 2b. Percentage of Total Undocumented Immigrants that are Age 50+ when they Migrate, by Region, 2000-2022 (3-year moving averages)
Increases in the age at arrival may help explain population aging for some groups. Figure 2b shows the percent of all undocumented immigrants that arrived at age 50 and older by region with comparisons for the entire undocumented population and for Mexico specifically. The portion of older (50+) arrivals among undocumented immigrants from Europe, Canada, and Oceania increased from 14 to 23 percent in the period. Likewise, among Asians, the share of older arrivals increased from 4 percent in 2000 to 18 percent in 2022. Older arrivals from South America and the Caribbean increased as well over the period, albeit more modestly. Nevertheless, the share of older arrivals remained low for the largest national origin groups: those from Mexico and Central America. Across the time frame, between 1 and 3 percent of those from Central America arrived at 50 and older. And by 2022 only 6 percent of undocumented immigrants from Mexico arrived at age 50 or older.
Because of their large size, undocumented immigrants from Mexico and Central America drive the aging patterns of the overall undocumented population. For all origins combined (bold line, Figure 2b), the share of undocumented immigrants arriving at age 50 and older has increased relatively slowly over the past twenty years from about 4 percent to about 8 percent, which is insufficient to explain the 23-percentage-point increase in the share of the undocumented population that is age 50 and older. Instead, the aging in place of undocumented immigrants, that arrived at younger ages, explains the growth in the undocumented older population as a whole.
Potential for Aging in Place: Age at Arrival and Duration in Undocumented Status
Age at arrival and expected duration in undocumented status together determine whether immigrants enter older adulthood with an undocumented status. For example, among those who arrive in childhood or early adulthood, groups with short durations spent in undocumented status are less likely to reach older adulthood as undocumented immigrants than those with long durations. Figure 3 visualizes specific countries by age at arrival and expected durations, averaged from 2015 to 2022 (see accompanying Appendix 2). Here, to the extent possible, we plot individual countries (with smaller countries grouped together into regions) instead of the region groupings plotted in Figure 2 because combining countries would mask heterogeneity in terms of the size of the undocumented flow and age at arrival by duration. The area of each circle indicates the size of the undocumented population from that country/region (Table 2, Column A). To assess age at arrival and duration patterns simultaneously, we divide the figure into quadrants: duration is split at the overall mean of 12.4 and age at arrival is split at age 35.5. Only about one-third of international migrants arrive in the U.S. at this age or older.7 We then categorize countries by quadrant: (1) young arrivals with long durations (blue), (2) middle age arrivals with short durations (orange), or (3) older arrivals (with shorter durations due to their shorter remaining life expectancy) (green). Summary statistics for these groups are shown in Table 2 with columns E and F presenting estimates by group for age at arrival and duration in undocumented status.
Figure 3. Average Age at Arrival and Expected Duration in Undocumented Status, 2015-2022.

Note on division of quadrants: The y-axis is split by mean expected duration of undocumented status for all countries. The x-axis is split at arrival age 35.5; two-thirds of immigrants arrive at this age or younger. The area of the markers is proportional to the population size of the group.
Table 2. Current Undocumented Immigrant Age Structure and Annual Entrants' Likelihood of Aging in Place – 2015-2022 (Standard error in parentheses).
| I. Current Undoc. Imm. Age Structure | II. Annual Undoc. Entrants' Likelihood of Aging in Place | |||||||
|---|---|---|---|---|---|---|---|---|
| (A) Ave. Pop Size (1,000s) |
(B) Age 50+ Pop (1,000s) |
(C) Percent Age 50+ |
(D) Annual Entrants (1,000s) |
(E) Average Age at Arrival |
(F) Duration In Undoc. Status |
(G) % Arrived Age 50+ |
(H) % Expected to age in place (arrived before age 50) |
|
| All Countries & Regions | 12,865 (24) |
2,592 (11) |
20.1% (0.1%) |
510 (2.80) |
27.9 (0.055) |
12.4 (0.16) |
9.5% (0.08%) |
21.4% (2.85%) |
| Group 1: Younger Arrivals, Long Duration | 9,197 (16) |
1,311 (7) |
14.3% (0.1%) |
279 (2.24) |
24.5 (0.07) |
15.5 (0.31) |
5.6% (0.09%) |
26.5% (3.16%) |
| Group 2: MidlifeArrivals, Short Duration | 3,053 (17) |
907 (8) |
29.7% (0.2%) |
207 (1.69) |
29.5 (0.09) |
9.7 (0.11) |
10.2% (0.13%) |
16.7% (3.58%) |
| Group 3: Older Arrivals | 615 (8) |
374 (4) |
60.9% (0.6%) |
24 (0.47) |
42.4 (0.28) |
8.4 (0.17) |
34.7% (0.51%) |
14.7% (7.19%) |
Estimates are provided for all countries and regions, as well as for the three groups in Figure 3. Group 1 includes Mexico, El Salvador, Honduras, Guatemala, Venezuela, Group 2 includes countries and regions not in Groups 1 and 3. Group 3 includes Canada, the United Kingdom, Vietnam and Phillippines.
Panel I uses residual estimates to gage that annual average undocumented population total size (Column A), number age 50+ (Column B), and percent age 50+ (Column C) from 2015 to 2023. Column C = Column B divided by Column A.
Panel II uses life tables to estimate average age at arrival for annual undocumented entrants from 2015 to 2022 shown in Column D. Columns E-H refer to annual entrants in Column D.
The first group (blue), young migrants with long expected durations in undocumented status, is clustered in the upper left-hand side of Figure 3 and is comprised of three Central American countries (Guatemala, El Salvador, Honduras), Mexico and Venezuela. Currently, while only 14.3 (Table 2, Column C) percent are age 50 or older, we expect this group to age in place in coming decades. On average, they arrive at age 24.5 and remain undocumented for 15.5 years (Table 2, Columns E and F), with a total of 32.2 percent of new annual entrants being expected to reach age 50+ while in undocumented status (Table 2, Columns G + H). Most of the expected aging of this group will be due to aging in place – i.e. only 5.6 percent arrived at ages 50+, and the remaining 26.5 percent expected to reach 50+ while undocumented will age in place. This large group makes up 71 percent of the undocumented immigrants living in the U.S.
The second group (orange), midlife arrivals with short expected durations in undocumented status, are clustered in the lower left-hand side and lower center of Figure 3. Already, 29.7 percent are age 50 and older and will remain at this level in coming decades because 26.9 percent of new entrants are expected to arrive at age 50 or older (10.2 percent) or reach age 50 or older in undocumented status (16.7 percent). This group includes a diverse set of origins – Caribbean countries, most South American countries, Africa, Oceania, some Central American countries and some Asian and European countries – that are likely to be a mixture of asylum seekers (e.g. Haiti) awaiting decisions on their cases, visa overstayers who have not yet regularized their status, and labor migrants engaged in circular migration. This moderately-sized group makes up 24 percent of undocumented immigrants.
The third group (green) are those who arrive at older ages and have relatively short expected durations in undocumented status. They are located at the lower right-hand side of Figure 3. On the far end with the oldest ages at arrival are immigrants from Canada, followed by immigrants from the UK, Philippines, and Vietnam. Currently, 60.9 percent are age 50 or older. This group will continue to contribute to the aging of the undocumented population due to their older age at arrival. Among new entrants, 34.7 percent arrive at age 50+, while only 14.7 percent arrive at young ages and age in place. This is a relatively small group, currently making up only 5 percent of all undocumented immigrants.
Health and Socioeconomic Correlates
To understand how the socioeconomic and health correlates of age at arrival differ by documentation status, Table 3 presents age- and sex-adjusted average years of schooling, poverty rate, and percentage with at least one functional limitation of likely undocumented (hereafter: undocumented) and likely documented (hereafter: documented) foreign-born persons aged 50 and older. For comparison, estimates for the US-born population are at the top of each panel of Table 3.
Table 3. Years of schooling, percentage in poverty, and percentage with a functional limitation by region of birth, likely immigration status and age at arrival, foreign born age 50+, 2018-2022 (adjusted for age and sex).
| Documented |
Undocumented |
|||||
|---|---|---|---|---|---|---|
| (A) | (B) | (C) | (D) | (E) | (F) | |
| Documented | Undocumented | Arrived 50+ |
Aged in place |
Arrived 50+ |
Aged in place |
|
| Average Years of Schooling (U.S. Born = 13.5 years) | ||||||
| All | 11.8 | 10.0 a | 11.3 d e f | 11.9 c e f | 10.4 c d f | 9.4 c d e |
| Mexico | 8.2 | 7.0 a | 7.6 d e f | 8.3 c e f | 6.8 c d | 7.2 c d |
| Central America | 9.4 | 7.1 a | 8.7 d e f | 9.5 c e f | 7.5 c d | 6.8 c d |
| Caribbean | 11.9 | 10.3 a | 10.9 d | 12.0 c e f | 10.3 d | 10.4 d |
| South America | 12.6 | 12.3 | 12.5 d | 12.7 c f | 12.4 | 12.1 d |
| Asian | 13.1 | 11.2 a | 11.7 d e f | 13.3 c e f | 11.2 c d | 11.1 c d |
| Europe/Oceania/North America | 13.9 | 13.3 a | 14.2 d e f | 13.8 c e f | 13.3 c d | 13.3 c d |
| Africa | 13.4 | 10.3 a | 11.8 d e | 13.7 c e f | 10.0 c d f | 11.2 d e |
| Percentage in Poverty (U.S. Born = 10.9%) | ||||||
| All | 12% | 25% a | 17% d e f | 11% c e f | 23% c d | 27% c d |
| Mexico | 15% | 26% a | 17% d e f | 15% c e f | 21% c d f | 29% c d e |
| Central America | 13% | 29% a | 13% e f | 13% e f | 26% c d | 31% c d |
| Caribbean | 16% | 27% a | 19% d e f | 15% c e f | 25% c d | 33% c d |
| South America | 11% | 22% a | 15% d e f | 10% c e f | 22% c d | 22% c d |
| Asian | 11% | 20% a | 15% d e f | 10% c e f | 18% c d f | 27% c d e |
| Europe/Oceania/North America | 9% | 28% a | 17% d e | 8% c e f | 31% c d f | 21% d e |
| Africa | 13% | 29% a | 17% d e f | 12% c e f | 24% c d f | 45% c d e |
| Percentage with at least 1 functional limitation (U.S. Born = 26.2%) | ||||||
| All | 19% | 23% | 21% d | 19% c f | 21% | 25% d |
| Mexico | 23% | 25% | 22% | 23% | 23% | 27% |
| Central America | 22% | 28% | 21% | 22% | 25% | 31% |
| Caribbean | 21% | 26% | 21% f | 21% f | 24% | 31% c d |
| South America | 17% | 16% | 17% | 17% | 15% | 19% |
| Asian | 18% | 20% | 22% d | 17% c | 20% | 22% |
| Europe/Oceania/North America | 17% | 19% | 19% d | 16% c | 18% | 20% |
| Africa | 19% | 23% | 21% d | 18% c e | 22% d | 25% |
Source: SIPP and ACS, 2018-2022 (N = 876,620). Likely immigration status was measured in the SIPP and imputed in the ACS using cross-sample multiple imputation. All estimates are adjusted for age and sex.
Superscripts indicate the significance of group differences based on 2-tailed t-tests (p<.05) with letters associated with the corresponding column letter.
Comparisons are made between adocumented and undocumented.
Comparisons are also made between colmuns C through F and: cdocumented/arrived at age 50+, ddocumented/aged in place, eundocumented/arrived at 50+, and fundocumented aged in place.
Comparing all documented and undocumented immigrants (Table 3, Columns A-B, superscript a), the undocumented have significantly fewer years of schooling and higher poverty rates; this is evident for nearly all regions of origin (there is no significant difference in education among South Americans). Documentation status is unassociated with the share with functional limitations.
Comparing by age at arrival within documentation status provides insight into the differential impact of U.S. experience. Pairwise significant differences (p<.05) are marked with superscript corresponding with the column letter. Among documented immigrants (comparing Columns C and D), aging in place is consistently associated with advantages: more years of schooling and a lower likelihood of poverty and functional limitations. Schooling and poverty advantages for those aging in place are seen for almost all regions of origin, but their advantages in functional limitations are significant only for Asians, Europeans/Canadians/ Oceanians, and Africans. Overall, this suggests that among documented immigrants, aging in place confers socioeconomic benefits and (for some origin groups) health benefits, while arrival in older adulthood may be negatively selected on these same factors.
For undocumented immigrants (comparing Columns E and F), we find no consistent evidence of an aging-in-place benefit. More often we observe non-significant differences by age at arrival. When a significant difference is evident, we largely observe disadvantages among those who aged in place. For undocumented immigrants from all regions combined, those who aged in place have fewer years of schooling (9.4) than those who arrived at ages 50 or older (10.4), although we see the opposite pattern for undocumented Africans. Additionally, undocumented immigrants from Mexico, Asia, and Africa who age in place tend to have higher poverty rates than those who arrived in the U.S. at 50 and older, although we see the opposite pattern for undocumented immigrants from Europe, Oceania, and North America. There are no significant differences in functional limitations by age at arrival for undocumented immigrants.
Finally, undocumented immigrants who aged in place tend to be the most socioeconomically disadvantaged of the four documentation status and age-at-arrival groups (comparing across Columns C-F). In comparison to the other three age at arrival and documentation status groups, undocumented immigrants who age in place have lower educational attainment among all origin groups combined, and higher poverty rates among Mexicans, Asians, and Africans.
Discussion
We extended research on population aging among U.S. undocumented immigrants from 27 countries or regions of origin and presented novel estimates of duration in undocumented status and the share expected to age in place. The results reveal dramatic increases in the older undocumented population across all origin groups, with particularly striking increases in the older population among undocumented immigrants from Asia, the Caribbean, Europe, Canada, and Oceania (Figure 2a).
We also show that population aging among undocumented immigrants is being driven by different demographic processes for different groups. Undocumented immigrants from Mexico, Central America, and Venezuela (Group 1 in Figure 3) are likely to age in place. Most in this group arrive in early adulthood and are likely to remain in undocumented status for many years. Although this group currently has a youthful age structure, low return migration rates and limited opportunities for legalization mean that 32.2 percent are either living as older undocumented adults now or will be within a few decades. In contrast, undocumented immigrants from Asia, Europe, Africa, and other regions (Group 2 in Figure 3) tend to arrive in midlife and remain in undocumented status for relatively short durations; about a fifth are likely to age in place. Those from Canada, United Kingdom, Philippines, and Vietnam (Group 3 in Figure 3) are much more likely to arrive in older adulthood and very few age in place. Overall, as the undocumented immigrant population has diversified beyond Mexico and Central America, those from newer origins have tended to arrive at older ages.
Despite these developments, undocumented immigrants from Mexico and Central America (Group 1 in Figure 3) will likely dominate the older undocumented population in coming decades. This group is very large (roughly 9.2 million8) and comprises nearly three-quarters of the undocumented population. A back-of-the-envelope calculation suggests that, even in the absence of new undocumented migration, Group 1 will contribute roughly 2.9 million () in Table 2) to the older undocumented population as it ages in place. The other two groups are much smaller. Our back-of-the-envelope estimates suggest that Group 2 will contribute 821 thousand and Group 3 will contribute 303 thousand to the older undocumented population.
Our analysis of the correlates of these migratory patterns (Table 3) highlights the socioeconomic disadvantages faced by older undocumented immigrants, especially for those who age in place. Aging in place is associated with clear socioeconomic advantages for documented immigrants. But for undocumented immigrants, in cases where an age at arrival difference is found, aging in place is associated with fewer years of schooling and higher poverty rates. In fact, undocumented immigrants who age in place – the largest group of undocumented immigrants in the U.S. – are more socioeconomically disadvantaged than any other documentation status and age-at-arrival group. It is important to note that we identify legal status from SIPP based on status at entry. This means that individuals who arrive without a green card but later adjusted to LPR are included among the “undocumented.” Therefore, the results show a conservative estimate of the undocumented population, and there is likely a greater difference between the documented and undocumented than evident here, with even worse outcomes for the undocumented.
These results have far-reaching implications. First, the observed growth in the share and number of older undocumented immigrants means that this socioeconomically vulnerable population will comprise a growing share of the older adult population in the U.S. Excluded from universal social welfare programs and with no path to legalization9, the growth of this population may erode the historic advances in older adult well-being made by the implementation of Social Security and Medicare in the last century. Additional research projecting the size of the older undocumented population and its characteristics into the future is necessary to understand the magnitude of the potential impact. Second, the fact that the increase in the older undocumented population is driven by aging in place means that this group, who has lived a considerable portion of its life in the U.S., likely has U.S. citizen children and grandchildren. Without access to retirement benefits or health insurance, undocumented older individuals will need financial and caregiving support from family members, which may hinder the socioeconomic mobility of the younger generation of American citizens.
It is important to consider the limitations of this analysis. First, estimates of age at arrival and duration undocumented are based on synthetic cohorts derived from cross-sectional data. This methodology enables us to extend research to include diverse immigrant origin groups not represented in longitudinal data but means that the results are sensitive to policy and economic changes that impact migratory behavior. For example, the estimated expected durations are based on past trends in outmigration and may not hold in the current enforcement context that aims to deport millions of undocumented immigrants. Second, results may be sensitive to assumptions underlying our residual estimates of the undocumented population, chiefly assumptions about foreign-born coverage error and emigration rates. Yet we assessed the sensitivity of the results to these assumptions in Appendix 3, and found the percentages age 50+, arrived age 50+ and expected to age in place to be fairly stable across both high (+50%) and low (−50%) coverage and emigration assumptions (see Appendix 3). Third, our estimates end in 2022 and do not include the most recent increase of entries at the U.S.-Mexico border. Accounting for more recent entries may change the age structure and estimated duration of the undocumented population, as well as the distribution of older immigrants by country and region of origin.
Notwithstanding these limitations, results point to legal status as a critical stratifying force in older adult well-being. With continued exclusion from social safety net programs and no pathway to legal status, individuals who have lived a large portion of their lives in the U.S. will be unable to age with dignity. On a societal level, the growth of the undocumented population aging in place will depress the socioeconomic well-being of older adults overall, as well as the younger generation of individuals supporting them.
Supplementary Material
Acknowledgments
This research was supported by a grant from the National Institutes of Aging (R01AG081306) and an infrastructure grant to the Population Research Institute at Penn State University from the Eunice Kennedy Shriver National Institute of Child Health and Human Development (P2CHD041025). We are also grateful to Zoya Gubernskaya and three anonymous reviewers for their helpful comments.
Footnotes
This method was described in this journal in 2021 (Van Hook et al., 2021), and we provide a slightly updated description in Appendix 1.
We assume that all pre-1982 arrivals have legal status because they were eligible for amnesty under the Immigration Reform and Control Act of 1986.
The ACS was not implemented at full scale until 2005, and the 2020 ACS was found to be of low quality due to difficulties in data collection during the first year of the COVID-19 pandemic, leading the U.S. Census Bureau to issue warnings about its use (U.S. Census Bureau, 2021). We therefore dropped all ACS estimates based on 2001-2004 and 2020 ACS data, and linearly interpolated the size of the size each cohort between 2000 and 2005 and between 2019 and 2021.
See Appendix 1 for more information about how we identify nonimmigrants in the ACS.
In spite of these calibrations, the number of likely visa overstayers is probably underestimated because some undocumented immigrants arrive on tourist visas. These visas expire after 6 months, so they would have become undocumented within their first year of residence and would therefore be classified as new arrivals in our estimates.
CMSI depends on meeting the same-universe assumption, whereby both the ACS and SIPP data set are drawn from the same universe. This condition is met because both the SIPP and ACS are representative of the U.S. population in 2018–2022. CMSI also depends on “joint observation”, meaning that all factors used in the analysis, apart from immigration status, must be observed in both the ACS and SIPP. The imputation model was informed by age, age-squared, sex, educational attainment, poverty, income, receipt of public benefits (Social Security income, Supplemental Security Income, and public health insurance), and the interaction of age with the receipt of public benefits, and all these factors are observed in the SIPP and ACS.
Analysis of ACS 2005-2022 data.
This is the average annual size of the undocumented population from Mexico and Central America between 2015 and 2023. The current size of this population as of 2023 is even larger.
Older undocumented individuals with US-citizen children are not eligible for legalization via family reunification because family reunification applies to beneficiaries who are outside the US and cannot have crossed irregularly into the US.
References
- Capps R, Bachmeier JD, & Van Hook J (2018). Estimating the characteristics of unauthorized immigrants using US census data: Combined sample multiple imputation. The Annals of the American Academy of Political and Social Science, 677(1), 165–179. 10.1177/0002716218767383 [DOI] [Google Scholar]
- Capps R, Gelatt J, Soto AGR, & Van Hook J (2020). Unauthorized Immigrant Data Tool. Migration Policy Institute. [Google Scholar]
- Cheong AR, & Massey DS (2019). Undocumented and Unwell: Legal Status and Health among Mexican Migrants. International Migration Review, 53(2), 571–601. 10.1177/0197918318775924 [DOI] [PMC free article] [PubMed] [Google Scholar]
- Diaz CJ, Koning SM, & Martinez-Donate AP (2016). Moving beyond salmon bias: Mexican return migration and health selection. Demography, 53(6), 2005–2030. 10.1007/s13524-016-0526-2 [DOI] [PMC free article] [PubMed] [Google Scholar]
- Duleep H, Liu X, & Regets M (2022). How the earnings growth of US immigrants was underestimated. Journal of Population Economics, 35(2), 381–407. 10.1007/s00148-021-00861-2 [DOI] [Google Scholar]
- Hall M, Greenman E, & Farkas G (2010). Legal Status and Wage Disparities for Mexican Immigrants. Social Forces, 89(2), 491–513. [DOI] [PMC free article] [PubMed] [Google Scholar]
- Kaushal N, Lu Y, Denier N, Wang JS-H, & Trejo SJ (2016). Immigrant employment and earnings growth in Canada and the USA: Evidence from longitudinal data. Journal of Population Economics, 29(4), 1249–1277. 10.1007/s00148-016-0600-5 [DOI] [PMC free article] [PubMed] [Google Scholar]
- Leach M (2017). Recent innovations in the US census bureau’s method of estimating foreign-born emigration. Annual Meeting of the Population Association of America, San Diego, CA. [Google Scholar]
- Markides KS, & Rote S (2019). The healthy immigrant effect and aging in the United States and other western countries. The Gerontologist, 59(2), 205–214. [DOI] [PubMed] [Google Scholar]
- Massey DS (2020). The Real Crisis at the Mexico-US Border: A Humanitarian and Not an Immigration Emergency. Sociological Forum, 35(3), 787–805. [DOI] [PMC free article] [PubMed] [Google Scholar]
- Massey DS, Durand J, & Pren KA (2015). Border enforcement and return migration by documented and undocumented Mexicans. Journal of Ethnic and Migration Studies, 41(7), 1015–1040. [DOI] [PMC free article] [PubMed] [Google Scholar]
- Morales JF (2021). Aging and undocumented: The sociology of aging meets immigration status. Sociology Compass, 15(4), e12859. 10.1111/soc4.12859 [DOI] [PMC free article] [PubMed] [Google Scholar]
- Passel JS (2005). Estimates of the Size and Characteristics of the Undocumented Population. Pew Hispanic Center. [Google Scholar]
- Passel JS, & Krogstad JM (2023). What we know about unauthorized immigrants living in the U.S (Short Reads). Pew Research Center. https://pewrsr.ch/3MNDkkW [Google Scholar]
- Rendall MS, Brownell P, & Kups S (2011). Declining Return Migration From the United States to Mexico in the Late-2000s Recession: A Research Note. Demography, 48(3), 1049–1058. [DOI] [PMC free article] [PubMed] [Google Scholar]
- Ro A, Van Hook J, & Walsemann KM (2022). Undocumented Older Latino Immigrants in the United States: Population Projections and Share of Older Undocumented Latinos by Health Insurance Coverage and Chronic Health Conditions, 2018–2038. The Journals of Gerontology: Series B, 77(2), 389–395. [DOI] [PubMed] [Google Scholar]
- Ruggles S, Flood S, Goeken R, Schouweiler Megan, & Sobek M (2022). IPUMS USA: Version 12.0 [dataset]. IPUMS. [Google Scholar]
- Schwabish JA (2011). Identifying rates of emigration in the United States using administrative earnings records. International Journal of Population Research, 2011(1), 546201. [Google Scholar]
- Sheftel MG (2024). Return migration and disability by life course stage of return: Evidence against the Salmon Bias. The Journals of Gerontology, Series B: Psychological Sciences and Social Sciences, 79(3), gbad171. [DOI] [PMC free article] [PubMed] [Google Scholar]
- U.S. Census Bureau. (2021, October 27). Pandemic Impact on 2020 American Community Survey 1-Year Data. Census.Gov. https://www.census.gov/newsroom/blogs/random-samplings/2021/10/pandemic-impact-on-2020-acs-1-year-data.html
- Hook Van, Gelatt Julia, & Ruiz Ariel. (2023). A Turning Point for the Unauthorized Immigrant Population in the United States. Migration Policy Institute. https://www.migrationpolicy.org/news/turning-point-us-unauthorized-immigrant-population [Google Scholar]
- Van Hook J (2024). Beyond Stocks and Surges: The Demographic Impact of the Unauthorized Immigrant Population in the United States. Population Development Review, 50(4), 1369–1400. [DOI] [PMC free article] [PubMed] [Google Scholar]
- Van Hook J, Morse A, Capps R, & Gelatt J (2021). Uncertainty about the size of the unauthorized foreign-born population in the United States. Demography, 58(6), 2315–2336. 10.1215/00703370-9491801 [DOI] [PMC free article] [PubMed] [Google Scholar]
- Ye LZ (2024). Latent cumulative disadvantage: US immigrants’ reversed economic assimilation in later life. Social Forces, 102(3), 1111–1133. [Google Scholar]
Associated Data
This section collects any data citations, data availability statements, or supplementary materials included in this article.