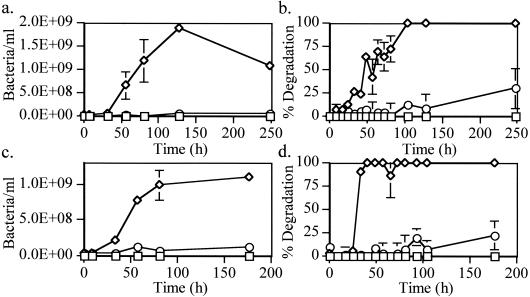
FIG. 2.
Growth and percent of BLC degradation by P. aeruginosa U1 (a and b) and U3 (c and d) isolates. Bacteria were established for up to 250 h under the following conditions: 2 mg of BLC ml−1 (⋄), 2 mg of BLC ml−1 plus EDTA (○), and 2 mg of BLC control ml−1 (□). Bacterial growth (a and c) was estimated by acridine orange direct counts and plotted as the number of bacteria per ml. The percentages of oil degradation (b and d) were calculated based on the detector response ratio of n-C17 plus n-C18 to pristane plus phytane at each time point compared to uninoculated controls. Each point represents the average and standard deviation of three replicate samples.

