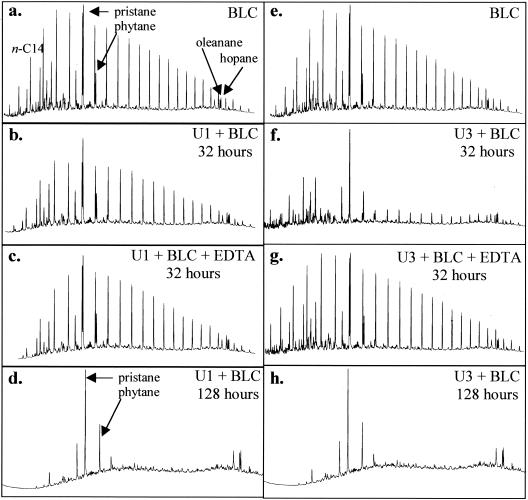
FIG. 3.
GC-FID traces of BLC after incubation with U1 and U3 isolates. (a) BLC control; (b) BLC incubated with U1 cells after 32 h; (c) BLC incubated with U1 cells and supplemented with 4 mM EDTA; (d) BLC incubated with U1 cells at 128 h; (e) BLC control; (f) BLC incubated with U3 cells after 32 h; (g) BLC incubated with U3 cells and supplemented with 4 mM EDTA; (h) BLC incubated with U3 cells at 128 h. All traces are representative of triplicate cultures. The x axes represent time (0 to 25 min), and the y axes represent detector response (1,000 to 8,000).

