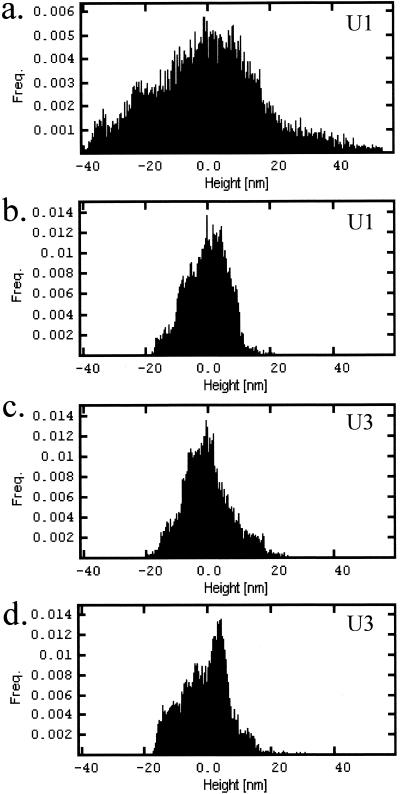
FIG. 5.
Height distribution histograms for P. aeruginosa U1 (a and b) and U3 (c and d) isolates established on either 2% glucose (a and c) or 2 mg of BLC ml−1 (b and d). Histograms were calculated from approximately 200- by 200-nm AFM high-resolution height scans of individual cell surfaces. Images were obtained with a Z range of 100 nm and were plane corrected.

