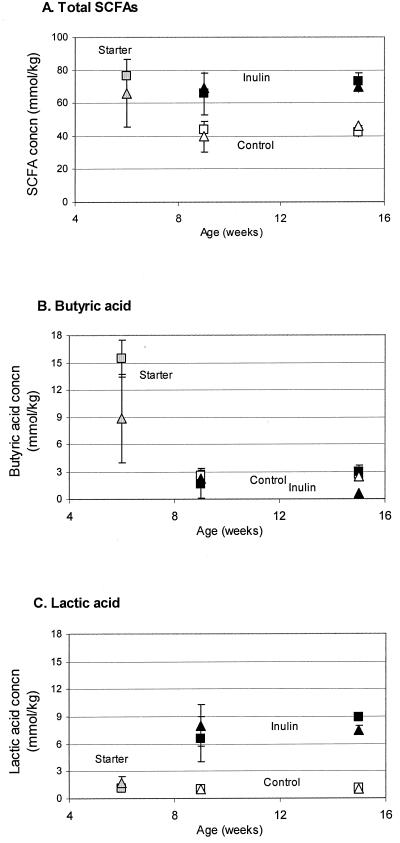
FIG. 2.
Effects of diet on cecal concentrations of short-chain fatty acids. Residual concentrations of short-chain fatty acids in the ceca of wild type and ApcMin/+ mice were analyzed by gas chromatography following the sampling scheme described in the legend of Fig. 1. (A) Concentration of total short-chain fatty acids; (B) concentration of butyric acid; (C) concentration of lactic acid. Colors of the symbols indicate different diets (gray, starter diet; white, control diet; black, inulin diet), and the shapes of symbols indicate the genetic backgrounds of the mice (triangle, wild type; square, ApcMin/+). Each data point represents two pools of 8 to 12 animals. Error bars show ± standard errors of the means.

