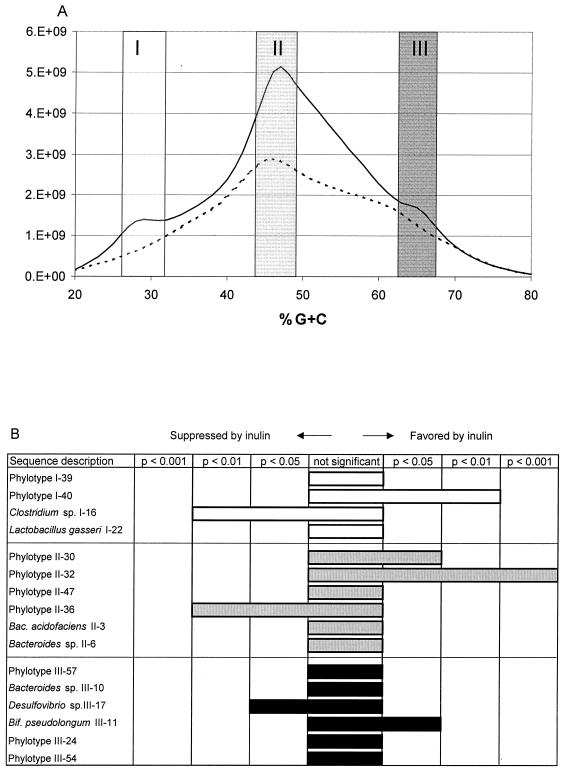
FIG. 4.
16S rDNA sequence analysis from %G+C fractions characteristic of the inulin diets. (A) Pooled %G+C profiles of all mice on the control diet (dotted line) and all mice on the inulin diet (solid line). Vertical columns show the fractions of DNA selected for 16S rDNA-based analysis from each profile. Fractions corresponded to 27 to 32% G+C (I), 44 to 49% G+C (II), and 63 to 68% G+C (III). (B) The effects of inulin on the abundance of dominant phylotypes were determined for all sequence phylotypes represented at least twice. The outcome is represented as a confidence plot where each phylotype is considered to be suppressed, show no significant effect, or be favored by inulin, with the corresponding confidence interval indicated (refer to Materials and Methods). White bars, phylotypes in fraction I of panel A; gray bars, phylotypes in fraction II of panel A; black bars, phylotypes in fraction III of panel A.

