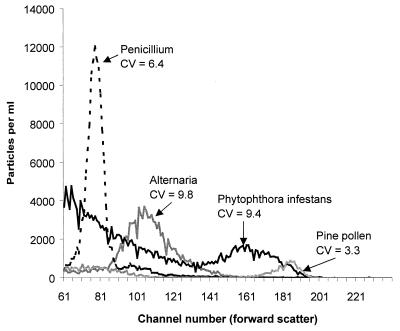
FIG. 1.
Individual light-scatter plots, overlaid, for sporangia of P. infestans, conidia of Penicillium chrysogenum and Alternaria spp., and pollen of a Pinus sp. (mean of four samples each) recorded in the Microcyte. The plot for P. infestans also shows a large number of small background particles, since these samples were collected from infected leaves. The CV ([standard deviation × 100]/mean channel number) was determined only for the range of channel numbers containing the sporangia or spores of interest.

