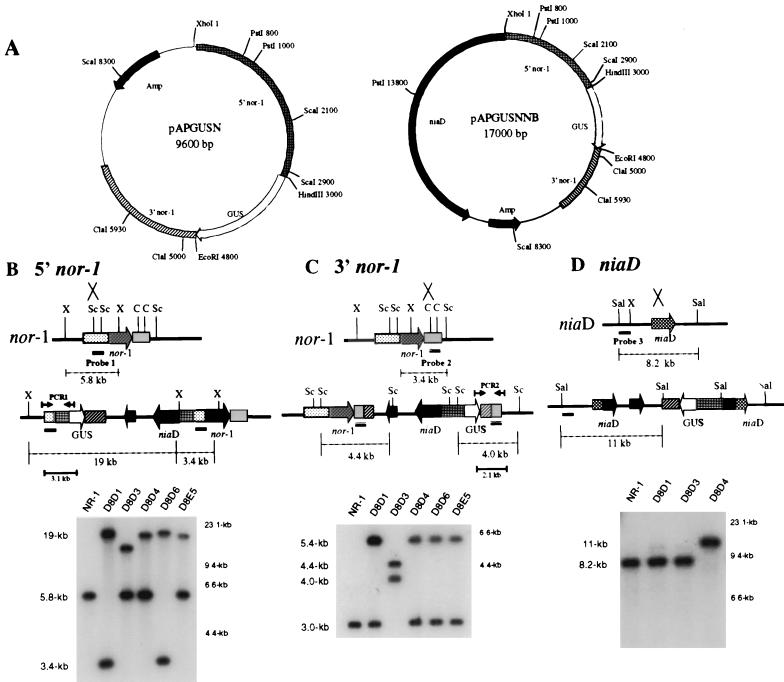
FIG. 1.
Southern hybridization analysis of site of integration in pAPGUSNNB transformants. (A) Restriction endonuclease maps of pAPGUSN and pAPGUSNNB. Only restriction endonuclease sites relevant to this study are shown. (B) Schematic for Southern hybridization and PCR analyses of pAPGUSNNB integration into the 5′ region of nor-1 and Southern hybridization data. A. parasiticus genomic DNA was digested with XhoI and probed with probe 1. Single-crossover integration of pAPGUSNNB into the 5′ region of nor-1 results in two bands, of 19 and 3.4 kb, and the disappearance of the 5.8-kb wild-type band. (C) Schematic for Southern hybridization and PCR analysis of pAPGUSNNB integration into the 3′ region of nor-1 and Southern hybridization data. Genomic DNA was digested with ScaI and probed with probe 2. Single-crossover integration of pAPGUSNNB into the 3′ region of nor-1 results in two bands, of 4.0 and 4.4 kb, and the disappearance of the 3.0-kb wild-type band. (D) Schematic for Southern hybridization and PCR analysis of pAPGUSNNB integration into niaD and Southern hybridization data. Genomic DNA was digested with SalI and probed with probe 3. Single-crossover integration of pAPGUSNNB into niaD results in an 11-kb Southern hybridization signal and the disappearance of the 8.2-kb wild-type band. Abbreviations: X, XhoI; Sc, ScaI; C, ClaI; Sal, SalI. The numbers in kilobases to the right of the Southern blots in panels B, C, and D represent molecular size markers. The numbers in kilobases to the left represent the sizes of actual restriction fragments observed in the analysis.

