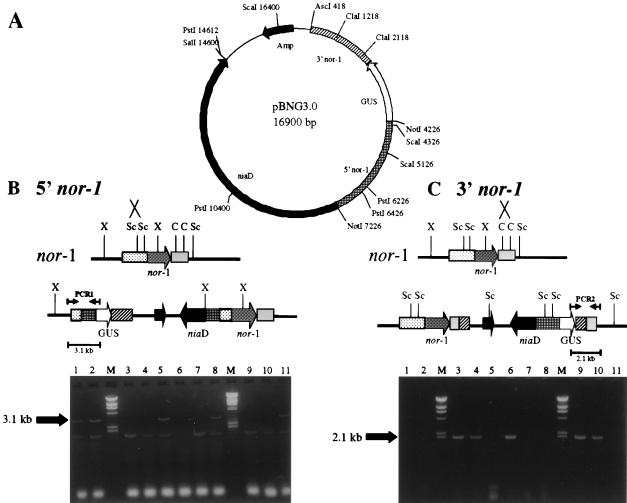
FIG. 8.
PCR analysis of site of integration in pBNG3.0 transformants. (A) Restriction endonuclease map of pBNG3.0. Only restriction endonuclease sites relevant to this study are shown. Template DNA was prepared using a rapid boiling procedure. Ten GUS+ transformants (lanes 1 to 6 and 8 to 11) and one GUS− transformant (lane 7) were analyzed for both 5′ and 3′ nor-1 integration. (B) Schematic for 5′ nor-1 integration with PCR data. 5′ nor-1 integrants resulted in a 3.1-kb PCR fragment (lanes 1, 2, 5, 8, 11) with PCR1 primers. (C) Schematic for 3′ nor-1 integration with PCR data. 3′ nor-1 integrants resulted in a 2.1-kb PCR fragment (lanes 3, 4, 6, 9, 10) with PCR2 primers. All GUS+ transformants were 5′ or 3′ nor-1 integrants while the GUS− transformant (lane 7) was negative for both 5′ (9B) and 3′ (9C) nor-1 integration. Lanes labeled M in panels B and C represent molecular size markers.

