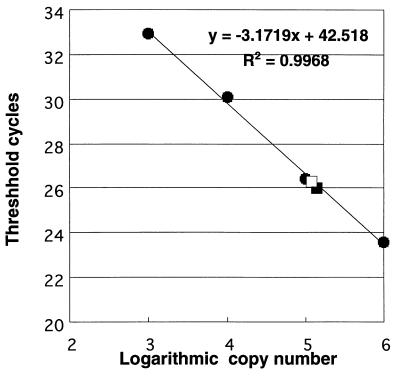
FIG. 3.
Real-time quantitative RT-PCR assay for evaluating sthA transcription. A standard curve was generated by plotting the threshold cycle (the cycle at which the fluorescent signal became detectable above the background signal) as a function of the log of the template copy number. sthA mRNA levels in filamentous cells (□) and single cells (▪) were calculated from the standard curve.

