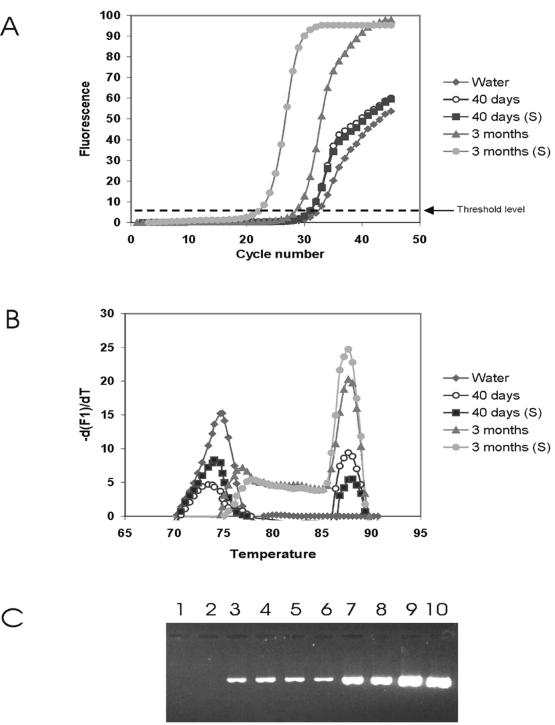
FIG. 5.
Comparison of urease A gene expression by real time RT-PCR of broth-cultured (40 days) and cold-starved (3 months) H. pylori prior to and after erythrocyte lysate stimulation (S). (A and B) Real-time detection (A) and melting-curve analysis (B) of amplified PCR products, using SYBR Green I and the LightCycler. (C) Agarose gel electrophoresis. Lanes 1 and 2, water control; lanes 3 and 4, 40-day cells; lanes 5 and 6, stimulated 40-day cells; lanes 7 and 8, 3-month cells; lanes 9 and 10, stimulated 3-month cells. The experiments were done in duplicate.

