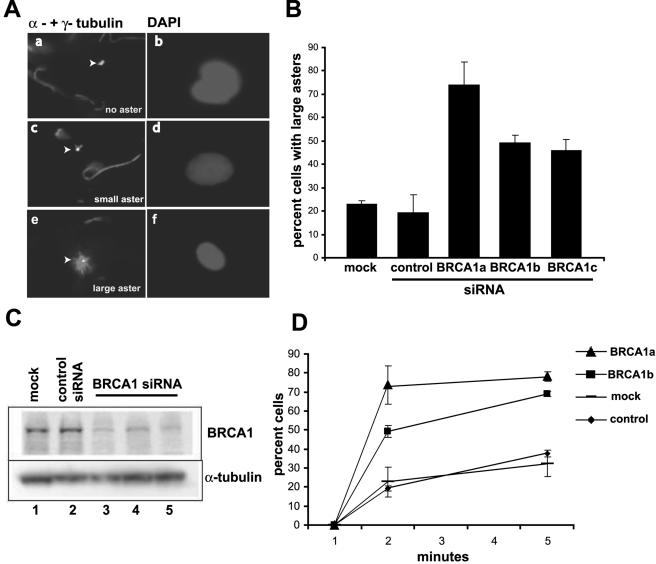
FIG. 1.
Inhibition of BRCA1 expression caused hyperactive MT regrowth in Hs578T cells. (A) Representative fields of the three different aster morphologies scored in the in vivo MT regrowth assay are shown. The left panels show α- and γ-tubulin staining, which mark MTs and centrosomes, respectively, and the right panels show 4′,6′-diamidino-2-phenylindole (DAPI) staining, which marks the position of the nucleus. All images were reproduced at the same magnification. Inactive centrosomes (Aa) and small asters (Ac) were obtained after transfection of Hs578T cells with the control siRNA. Large asters (Ae) were observed in cells transfected with the BRCA1-specific siRNA. Large asters have ∼10 microtubules of length, comparable to the nucleus, whereas small asters have 1 or 2 very short microtubules associated with the centrosome. Arrowheads indicate centrosomes and asters. (B) Hs578T cells were transfected with BRCA1-specific siRNAs, a control siRNA specific for luciferase, or no siRNA (mock). Forty-eight hours posttransfection, cells were subjected to the MT regrowth assay. The cells were fixed and stained after MT regrowth was allowed for 2 min. The percentages of cells with large asters, plus the standard errors of the means, from three independent experiments are graphed. (C) Western blot analysis of BRCA1 protein levels after cells were either transfected with siRNAs specific for the control (lane 2), BRCA1a (lane 4), BRCA1b (lane 3), or BRCA1c (lane 5) or mock transfected (lane 1). α-Tubulin levels were determined on the same blot as a control for equal loading. (D) Time course of the regrowth assay and the appearance of cells containing large asters after either no siRNA transfection (mock) or transfection with two different siRNAs specific for BRCA1 (BRCA1a and BRCA1b) or a control siRNA, as indicated. The data for the 2-min time point were averaged from three experiments, and the data for the 5-min time point were averaged from four experiments.

