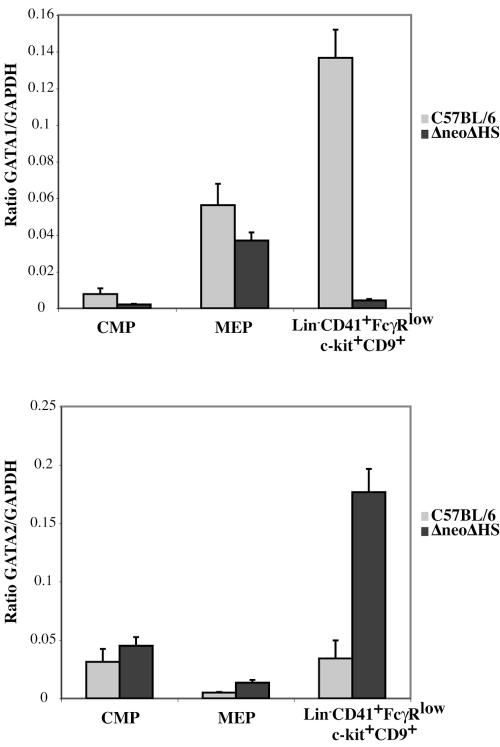
FIG. 4.
Expression levels of GATA1 and GATA2 in sorted progenitor populations. TaqMan real-time RT-PCR quantitation of GATA1 (top panel) and GATA2 (bottom panel) mRNA expression normalized to GAPDH is shown in FACS-sorted wild-type and ΔneoΔHS fetal liver CMP, MEP, and Lin− CD41+ FcγRlow c-kit+ CD9+ progenitor populations.

