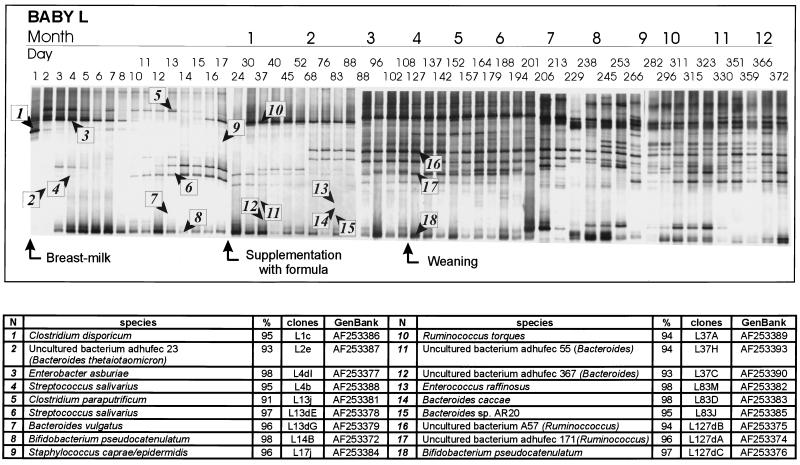
FIG. 2.
(A) PCR-DGGE profiles representing the bacterial diversity in baby L generated from samples taken from birth to 372 days. Both the day and the approximate time of the month of sampling are indicated. Changes in the diet, such as addition of formula milk, are indicated by arrows. The bands identified from the 16S rDNA clone libraries are numbered and are indicated by arrowheads; these bands are described in the table in panel B. (B) Closest relative as determined by comparative sequence analysis, level of identity with this relative, clone designation, and accession number for each band identified in panel A.

