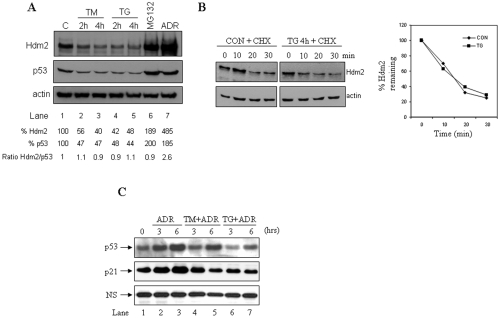
FIG. 2.
Inhibition of Hdm2 expression in ER-stressed cells. (A) Downregulation of p53 and Hdm2 proteins by ER stress. A549 cells were left untreated or treated with either 10 μg of TM/ml (lanes 2 and 3) or 1 μM TG (lanes 4 and 5) for the indicated times. Cells were also treated for 4 h with 10 μM MG132 (lane 6) or 1 μM ADR (lane 7) to stabilize p53 (controls). Protein extracts (50 μg) were subjected to immunoblotting with anti-p53 (DO-1) Ab (top panel), anti-Hdm2 Ab (middle panel), or antiactin Ab (bottom panel). Hdm2 and p53 protein levels were normalized to actin by using Scion Image 2.0 software. (B) Hdm2 stability in ER-stressed cells. A549 cells were untreated or treated with 1 μM TG for 4 h, followed by a 40-μg/ml cycloheximide chase for the indicated time. Protein extracts (50 μg) were subjected to Western blotting with anti-Hdm2 Ab (top panel) and antiactin Ab (bottom panel). The exposures shown are different so that the p53 levels in control (CON) and TG-treated cells for time zero (lanes 1 and 5) are equal. Hdm2 levels were normalized to actin levels by using Scion Image 2.0 software, and the ratio in unstressed (control) and ER-stressed cells (TG) plotted against the time is shown. (C) WI-38 cells were treated with 1 μM (adriamycin) ADR alone or with either 10 μg of TM/ml or 1 μM TG for the indicated times. Protein extracts (50 μg) were used for immunoblotting with an anti-p53 rabbit polyclonal Ab (top panel) or with an anti-p21 polyclonal Ab (middle panel). A nonspecific (NS) band was used as a loading control (bottom panel).

