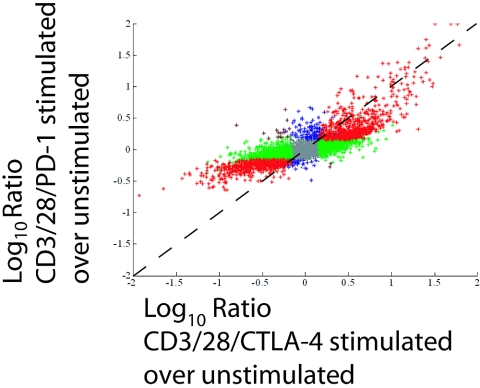
FIG. 6.
PD-1 and CTLA-4 engagement each uniquely affect the T-cell transcriptional profile. Primary human CD4 T cells were cultured for 24 h with either CD3/CD28/CTLA-4- or CD3/CD28/PD-1-coated beads. Total RNA was isolated, amplified, and analyzed by DNA microarray hybridization. Shown are comparisons (correlations) of genes significantly regulated (P < 0.01; intensity, >−1) in CD3/CD28/CTLA-4-stimulated T cells (x axis) versus that in CD3/CD28/PD-1-stimulated T cells (y axis). The color scheme is as follows: red genes represent genes significantly regulated under both conditions; green genes represent genes significantly regulated in the x dimension; blue genes represent genes significantly regulated in the y dimension; brown genes represent genes showing opposite regulation in the two conditions; gray genes are transcripts not significantly regulated in either dimension. This experiment was repeated twice with equivalent results. The gene lists for each of these distinct regulations are found in Table S1 in the supplemental material.

