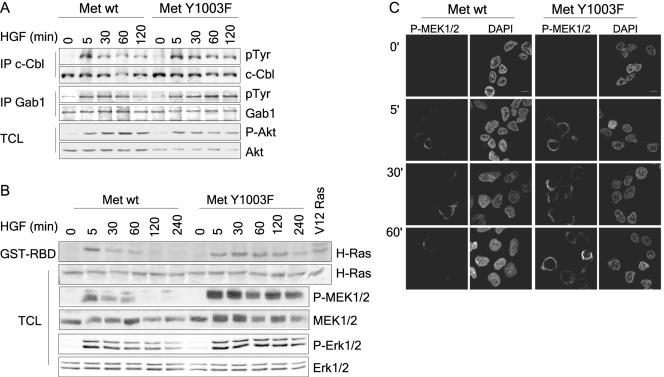
FIG. 3.
Activation of the Ras-MAPK but not the PI3K pathway is sustained downstream from Met Y1003F. (A) T47D cells were stimulated with 1.5 nM HGF for the indicated times and lysed in TGH buffer. In the upper two panels, c-Cbl proteins were immunoprecipitated and immunoblotted with phosphotyrosine antibodies. Membranes were stripped and blotted with Cbl antibodies. In the middle two panels, Gab1 proteins were immunoprecipitated and blotted with both antiphosphotyrosine, 4G10, and Gab1 antibodies using the Odyssey Infrared Imaging System (LI-COR). In the bottom two panels, lysates were blotted with either phospho-Ser473 or total Akt antibodies as indicated using the Odyssey system. (B) T47D cells were stimulated with 1.5 nM HGF and lysed as above. Upper two panels: Ras activation was determined using an in vitro binding assay with the GST-RBD fusion protein, with HEK293T cells expressing V12 H-Ras as a positive control. Panels were blotted with an H-Ras antibody using the Odyssey System. In the bottom four panels, cell lysates were blotted with phospho-Ser217/221 MEK1/2, total MEK1/2, phospho-Thr202/Tyr204 Erk1/2, and total Erk1/2 antibodies as indicated using the Odyssey system. (C) T47D cells were plated on coverslips, serum starved for 16 h, and stimulated with 1.5 nM HGF at 37°C for the indicated time points. Coverslips were fixed in 3% paraformaldehyde (PFA), and stained with phospho-Ser217/221 MEK1/2 (first panel). Cell nuclei were visualized using 4′,6′-diamidino-2-phenylindole (DAPI) (second panel). Confocal images were taken with a 100× objective and 2× zoom. The bar represents 5 μm.

