FIG. 1.
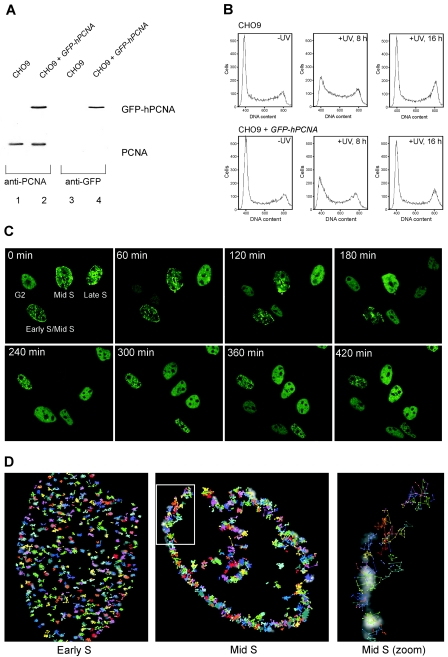
Characterization of CHO9 cells expressing GFP-hPCNA. (A) Immunoblot analysis. Whole-cell extracts of CHO9 cells and CHO9 cells stably expressing GFP-hPCNA were analyzed for the presence of endogenous PCNA and GFP-hPCNA by immunoblotting using antibodies against PCNA (left panel) and GFP (right panel). (B) Cell cycle analyses. CHO9 cells and CHO9 cells expressing GFP-hPCNA were irradiated with UV light (10 J/m2). After the indicated time points, the cells were analyzed for DNA content using a fluorescence-activated cell sorter. In each histogram, the counted cells are plotted against the relative fluorescence intensities derived from the propidium iodide signal. (C) Time-lapse imaging of four cells expressing GFP-hPCNA. Cells were imaged every 10 min during a 5-h period. Shown are the images taken every 60 min. All four cells will go through cell division and follow the characteristic PCNA focal pattern. Small dots are characteristic for early S phase, staining at the periphery of the nucleus marks the mid-S phase, and big blobs mark the late S phase. The G2 cell divided first and, depending on their stages in S phase, the other cells followed. (D) Analysis of movement of PCNA replication structures in living cells done by tracking individual PCNA replication structures in single cells. In the background, the PCNA staining pattern at time point zero is shown in grayscale. Positions of the centers of replication structures were determined in each frame of a movie from the focal plane of a cell, and consecutive positions were connected by lines. Cells were examined for 30 min using time-lapse video microscopy at intervals of 30 s. The coordinates of each focus in the cell were determined at every 30-s time interval (Volocity; Improvision). Each individually colored track represents the movement of a different focus during the period captured. The last image shows the zoom image of the mid-S-phase cell.

